Dashboard Help & FAQ
Everything you need to know about the Swiss Whale Intelligence Dashboard — from getting started to understanding every feature in Free and Premium mode.
1. Getting Started
When you visit the dashboard, you see the login screen with two options:
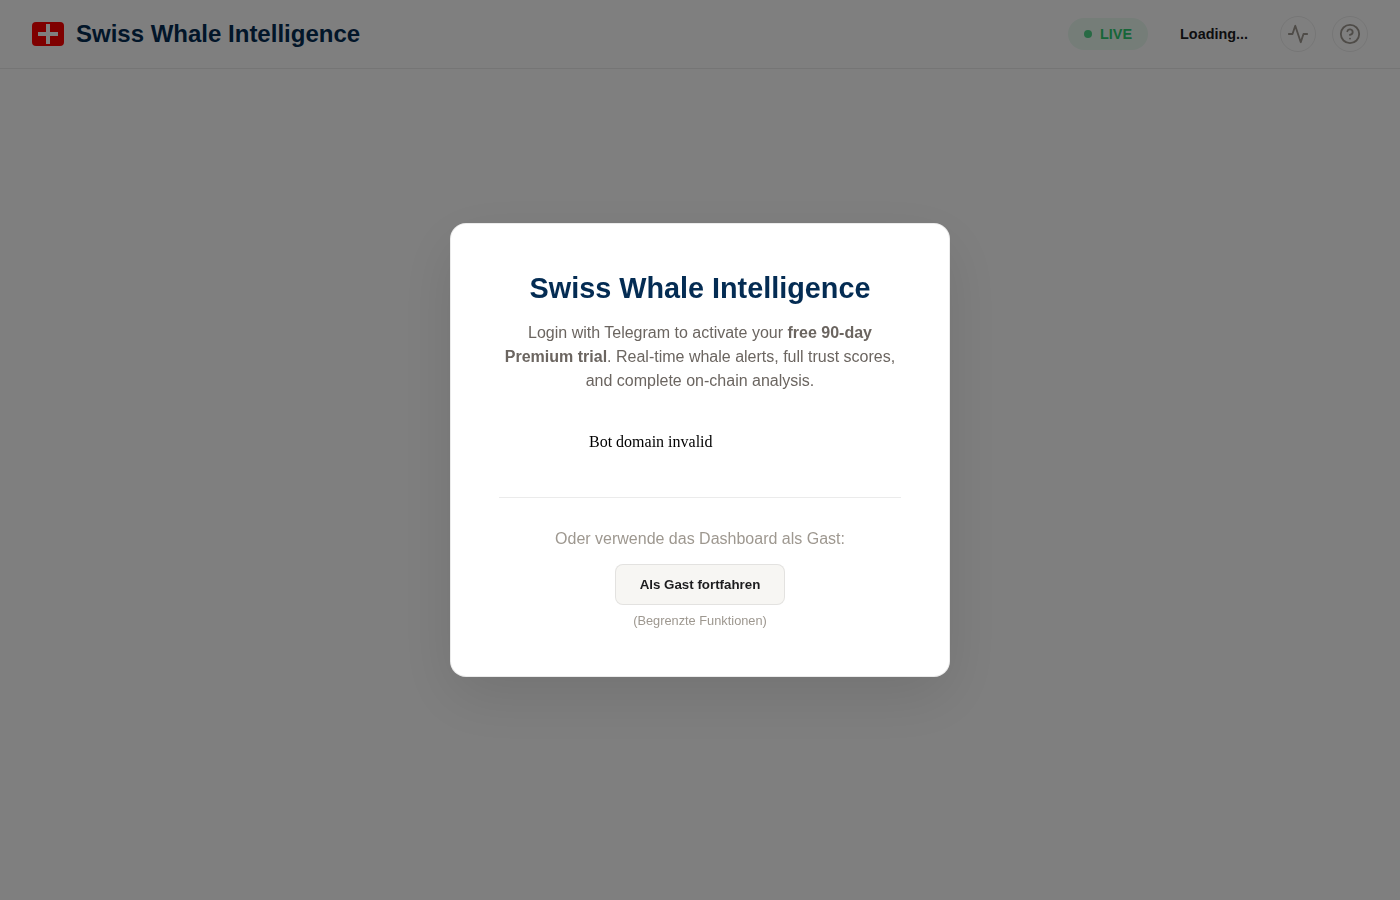
The login screen — sign in with Telegram or continue as guest
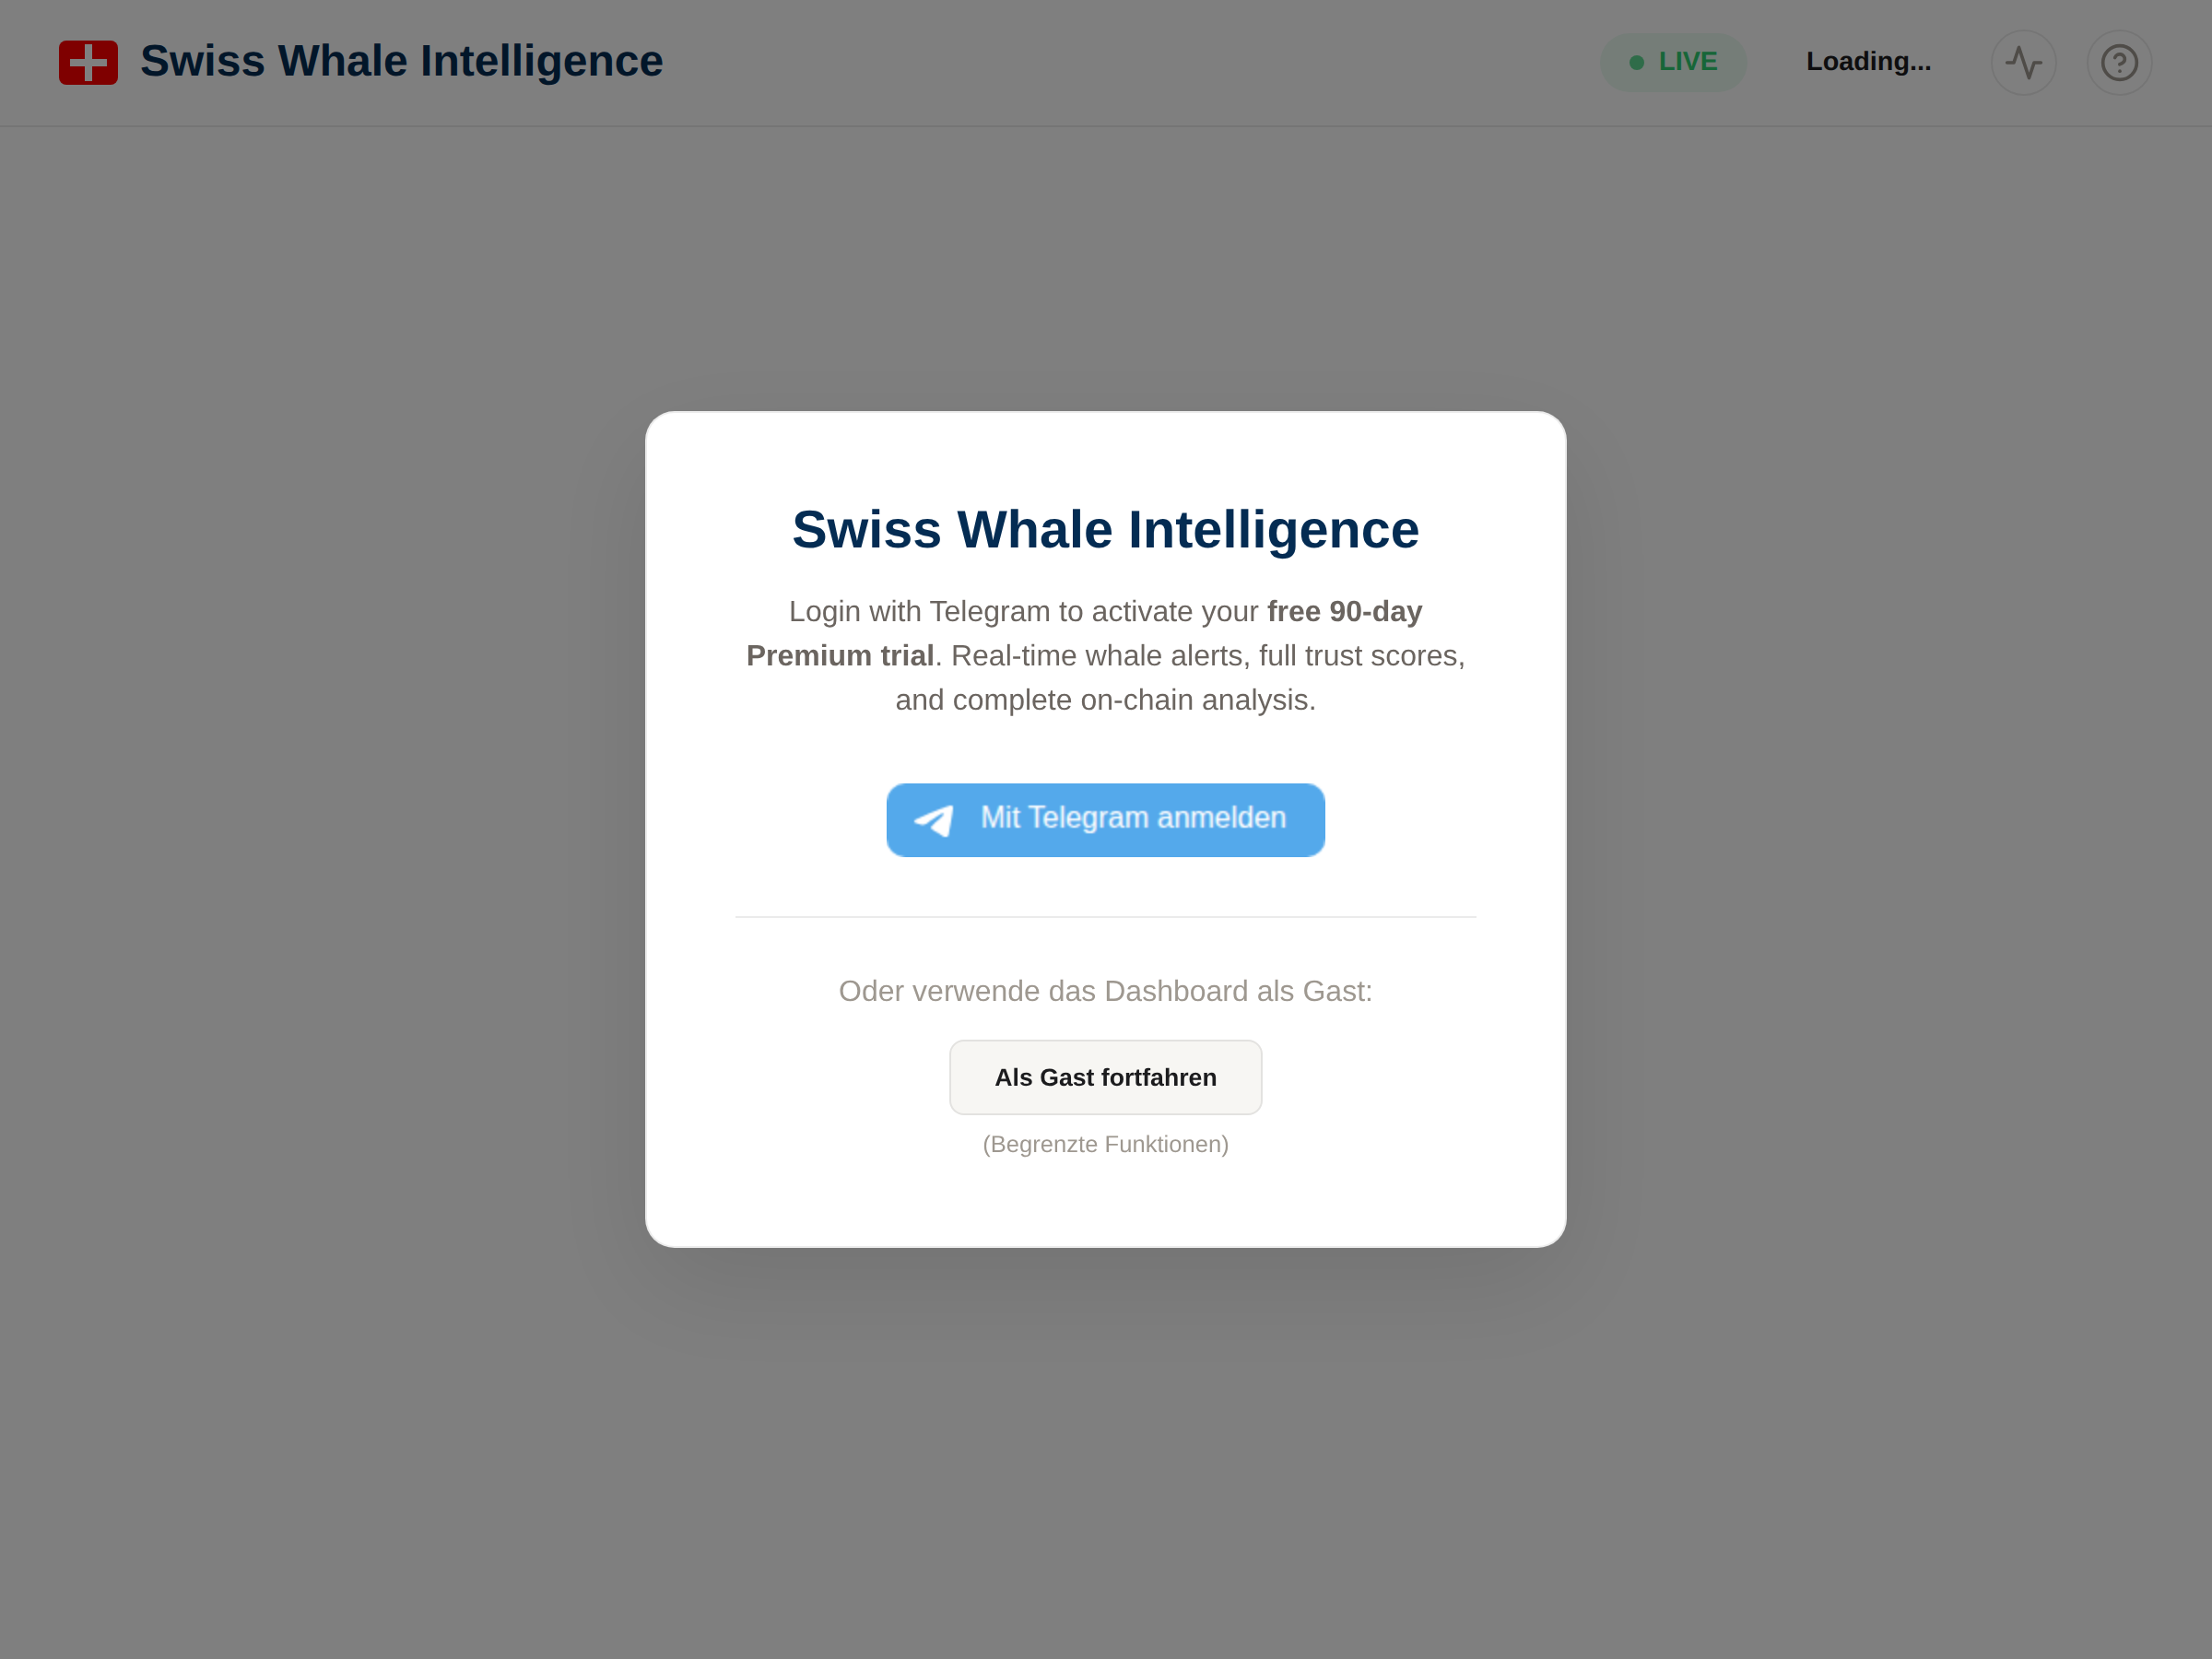
The login modal — free 90-day Premium trial with Telegram login
Option A: Sign in — Free 90-Day Intelligence Trial
Three ways to sign in, all activate the same free 90-day Intelligence Trial — no credit card, no payment, no commitment. After 90 days the account auto-steps-down to Observer (free permanent), no auto-charge.
- Telegram (1 click): the official Telegram Login Widget. Fastest way in.
- Google (1 click): Sign in with Google — only your Google sub-id and email are stored.
- Email + Password: classic email signup. Verification email arrives within ~30 seconds.
Option B: Continue as Guest (Free Mode)
Use the dashboard without an account. You get access to all charts and statistics, but the whale feed shows delayed (3h) and rounded data. You can upgrade to Intelligence Trial at any time via Telegram, Google, or email.
Stay Updated: Alerts Across Platforms
Swiss Whale Intelligence delivers alerts across multiple platforms:
- Bluesky: @btcwhalealerts.com — 5 custom feeds (All Alerts, Exchange Inflows, Exchange Outflows, Mega Whales 1000+ BTC, High Impact)
- Telegram: @btcwhalealerts (free) and @SwissWhalePremiumBot (premium with signed analysis links)
- Discord: Join server (DE/EN/ES channels, free and premium alerts)
2. Dashboard Overview
Here is what the dashboard looks like in Free and Premium mode. Both have access to all charts and stats — the key differences are in the whale feed (data freshness, detail level).
The dashboard uses a clean light theme with IBM Plex Mono for numbers and addresses. All pages — including alert detail pages, whale profiles, and public TX pages — share the same consistent design.
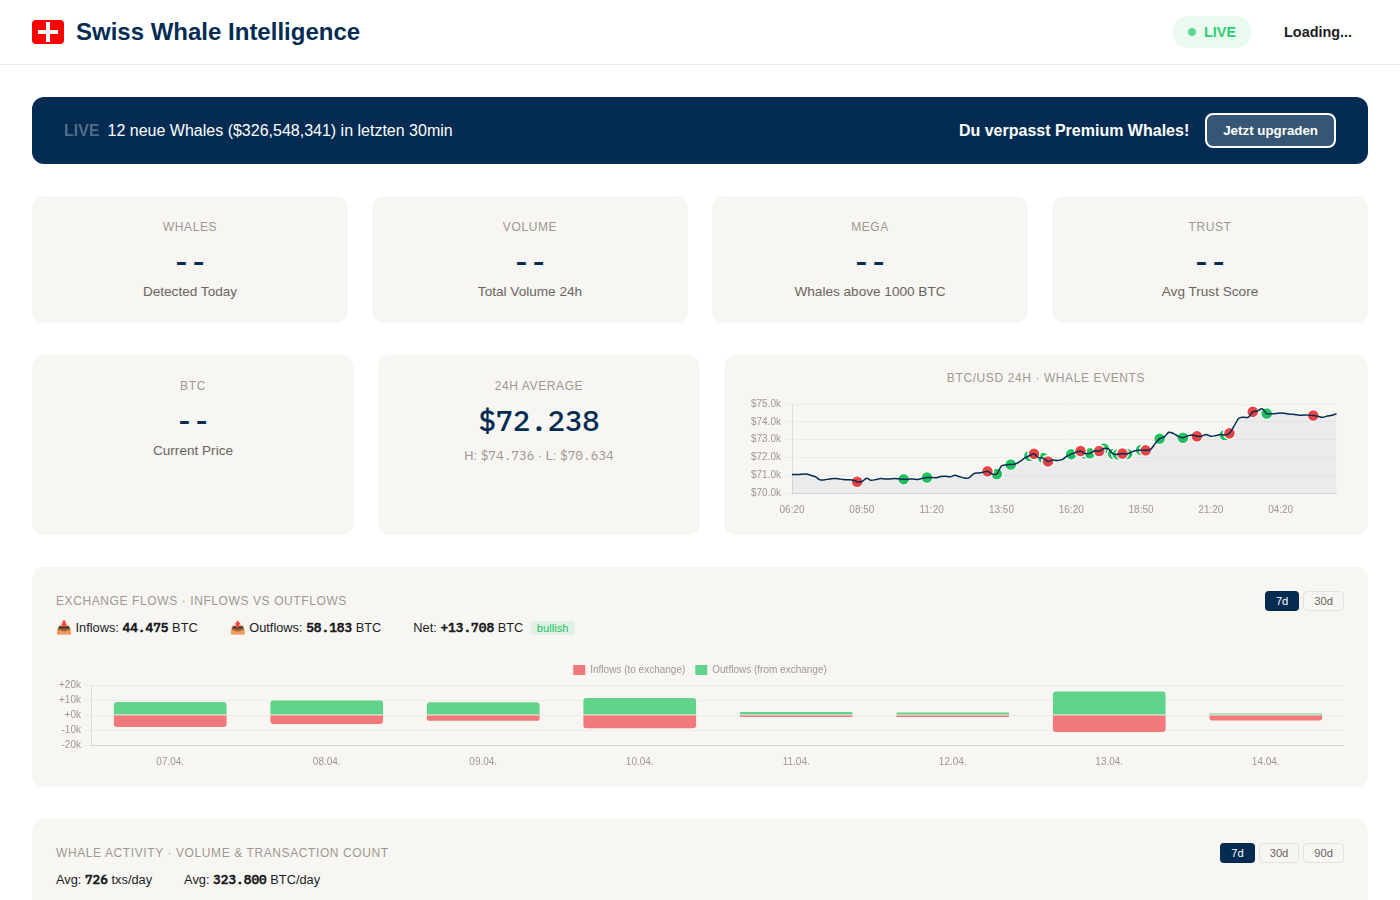
Left: Free mode with upgrade banner. Right: Premium with "REAL-TIME" badge and full data.
Real-Time Stats
Whale count, 24h volume, mega whales, volume index — updated every 30 seconds. Available in both Free and Premium.
Price & Whale Overlay
24h BTC chart with whale events as colored dots. See how large transactions correlate with price. Available in both modes.
Exchange Flow Analysis
BTC flowing to/from exchanges, classified by net direction. 7d and 30d views. Available in both modes.
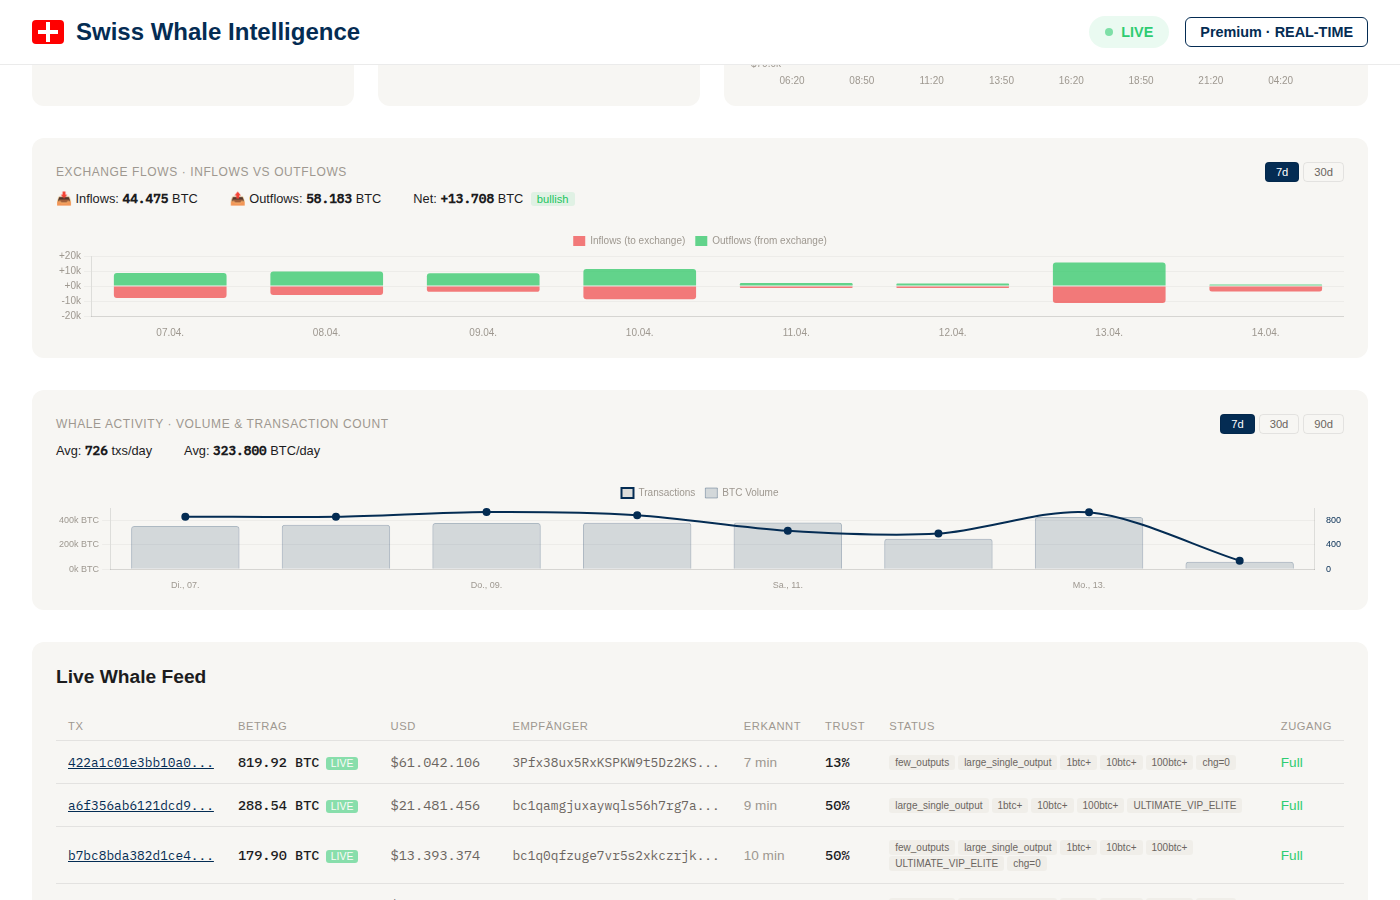
Live Whale Feed
Transaction table with amounts, addresses, volume indices. Premium: real-time, full detail. Free: 3h delay, limited.
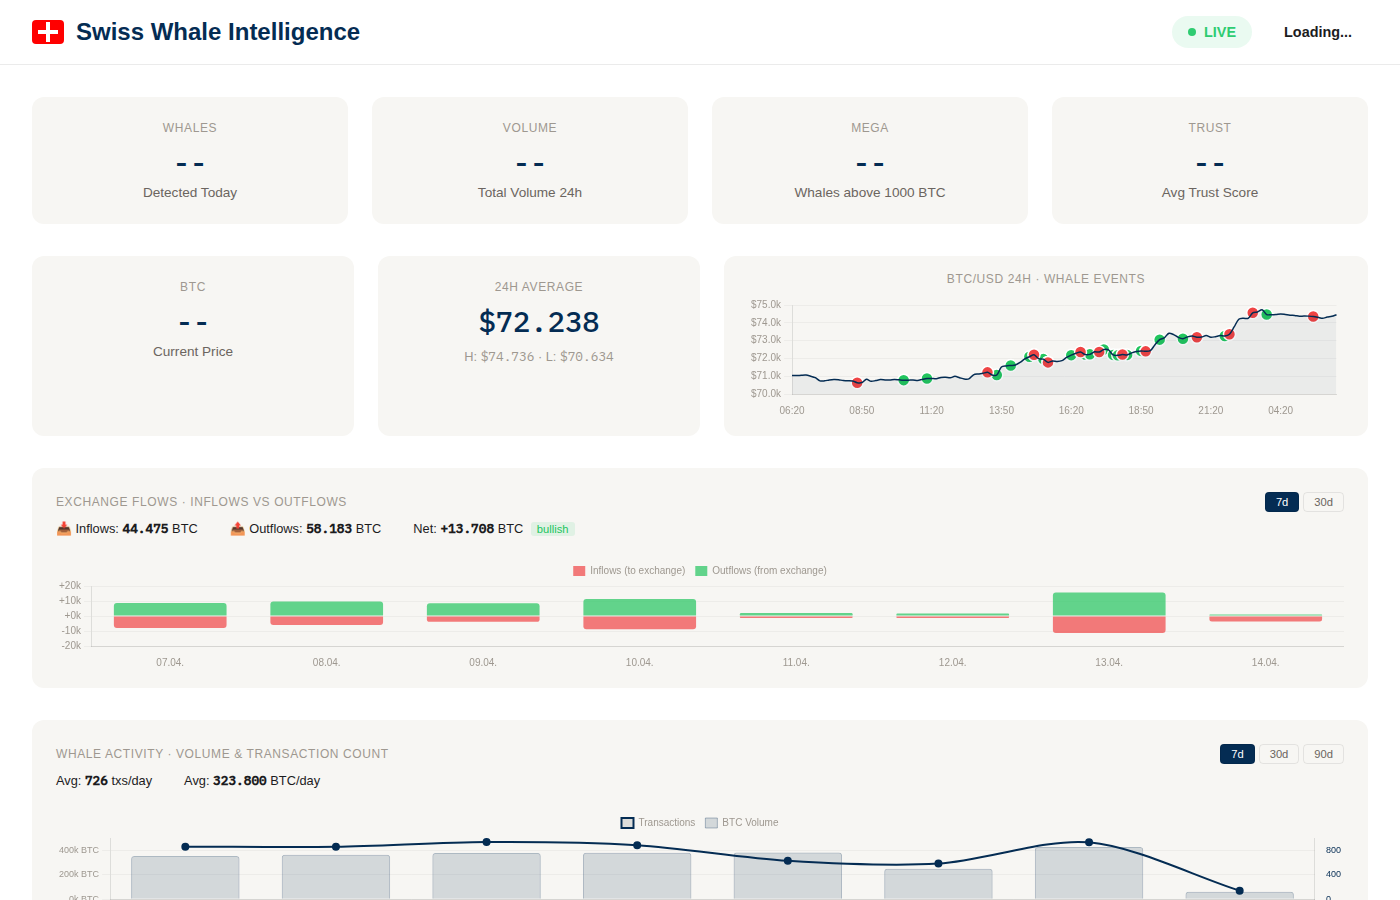
3. Stats Cards & BTC Price
The top rows show key metrics at a glance. These are identical in Free and Premium.
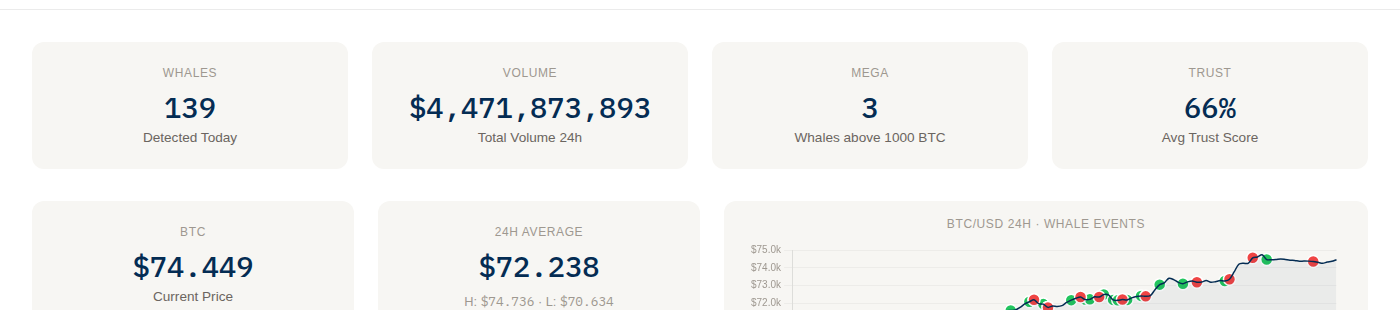
Stats overview: key metrics + BTC price with 24h chart
BTC current price, 24-hour average with high/low, and price chart with whale event overlay
Whales Detected Today
Number of large BTC transactions in the last 24 hours. Typically 100–300 per day.
Total Volume 24h
Combined USD value of all whale transactions. Shown in millions or billions.
Mega Whales (>1000 BTC)
Extremely large transactions. Rare but significant — often institutional or exchange moves.
Avg Volume Index
Average Volume Index across today's whales — reflects historical exchange-flow magnitude. NOT a profitability signal (see FAQ).
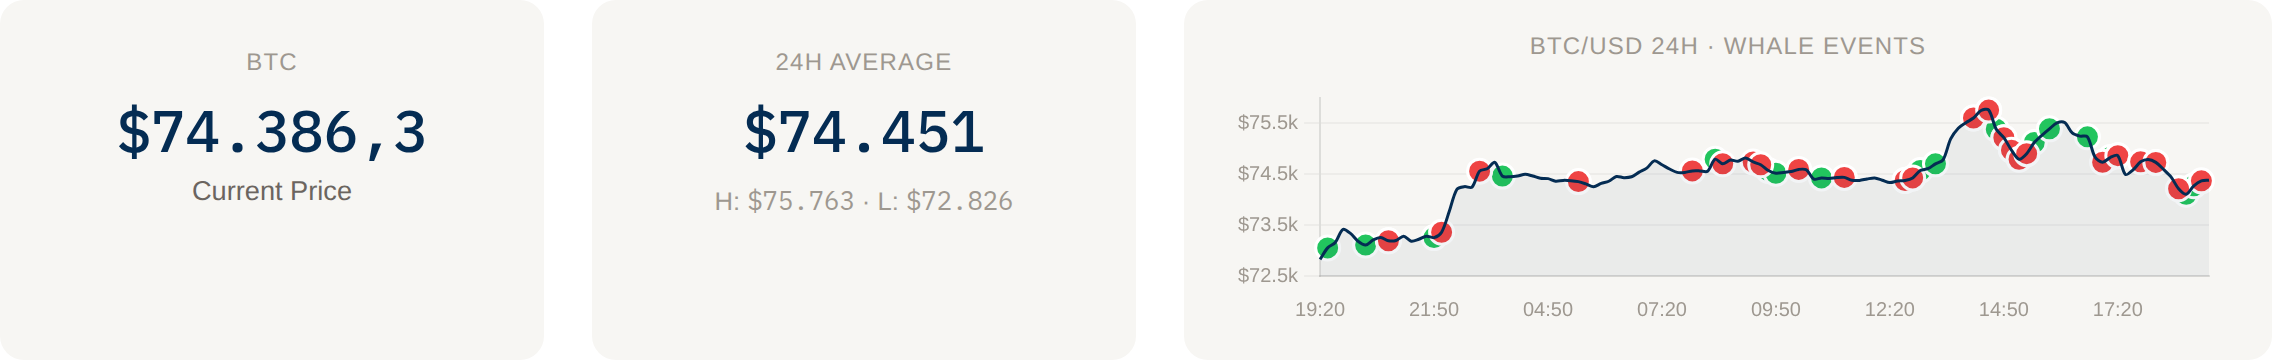
BTC Price Row
Current Price — latest BTC/USD. 24h Average — mean price with High (H) and Low (L) markers. The 24h chart plots BTC/USD as a line with whale events as colored dots overlay.
4. BTC Price Chart with Whale Events
The 24h price chart overlays whale transactions as colored dots directly on the price line. This lets you visually check whether whales tend to move BTC before, during, or after price swings.
Charts area: Exchange flows (top) and whale activity (bottom)
5. Exchange Flows — Inflows vs. Outflows
One of the most valuable on-chain indicators. Tracks how much BTC moves to and from known exchange addresses.
- Inflows (red bars) — BTC sent to exchanges. Often indicates intent to sell.
- Outflows (green bars) — BTC withdrawn from exchanges. Typically indicates accumulation or cold storage.
- Net flow + direction badge — Difference between outflows and inflows, labeled outflow-dominant / inflow-dominant / balanced.
Toggle between 7d, 30d, and 90d using the buttons in the top-right corner. The summary shows totals for Inflows, Outflows, and Net in BTC.
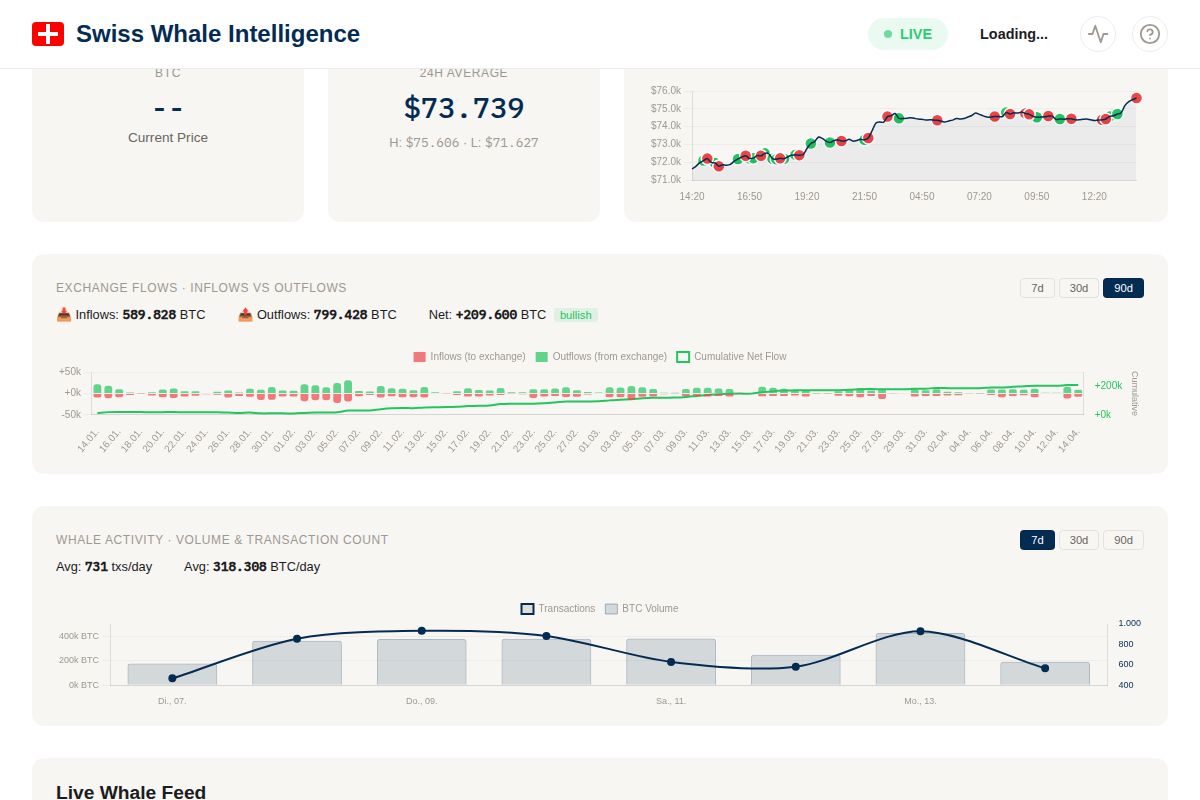
Exchange Flows: 90-day view with inflow/outflow bars and cumulative net flow line
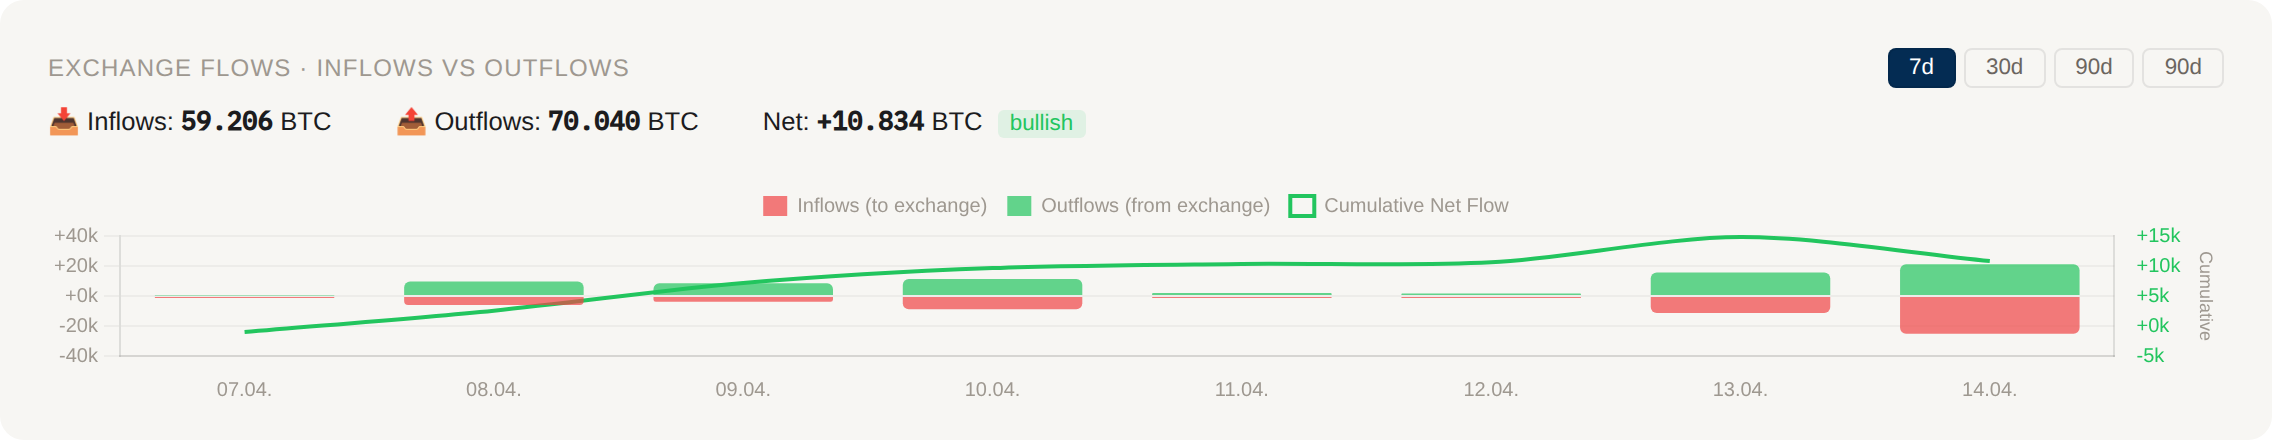
7-day exchange flow view with inflow (red) and outflow (green) bars
Cumulative Net Flow Line
A line overlaid on the bar chart shows the cumulative net flow over the selected period. This reveals the long-term trend:
- Rising green line — Sustained outflows over time (outflow-dominant trend)
- Falling red line — Sustained inflows over time (inflow-dominant trend)
The right Y-axis shows the cumulative scale in BTC.
Exchange Reserves Trend
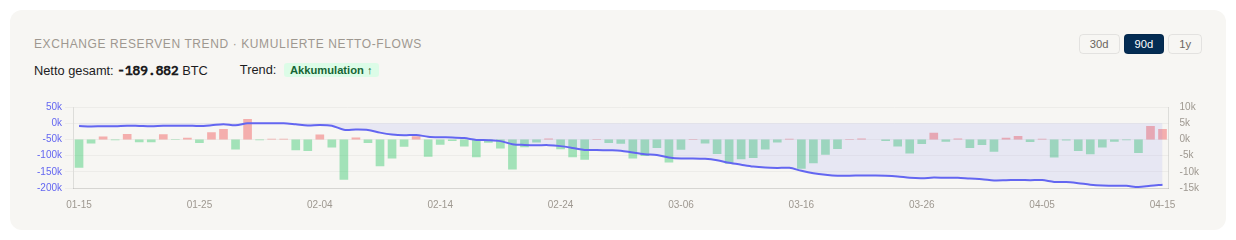
Exchange Reserves Trend: cumulative net flows (purple area) with daily net bars (red/green)
A dedicated chart showing cumulative net flows as a proxy for exchange reserve changes over time. This approximates what services like Glassnode charge for.
- Purple area line — Running total of net inflows (inflows minus outflows) over the period
- Daily bars — Red bars = net inflow day (to exchange), green bars = net outflow day (from exchange)
- Trend label — "Accumulating" (more BTC leaving exchanges) or "Distributing" (more BTC entering)
Toggle between 30d, 90d, and 1y views. Based on 133K+ tracked exchange flows since September 2020.
Per-Exchange Reserves (Binance)
An "All Exchanges / Binance" toggle on the same chart switches to per-exchange reserves. Currently only Binance is wired up — Coinbase, Kraken, and others will follow as their address coverage grows.
Methodology
Per-exchange reserves are calculated as the cumulative net flow of BTC into and out of identified Binance addresses:
- Inflow = transactions where a non-Binance address sends BTC to a Binance address.
- Outflow = transactions where a Binance address sends BTC to a non-Binance address.
- Net flow = inflow − outflow per day.
- Cumulative net = running sum over the selected period.
Address Identification
Binance addresses come from btc_entity_labels, populated by two methods:
- Curated labels (8 addresses) — from public disclosures and Proof-of-Reserves attestations.
- Cluster-traced labels (4 addresses) — derived from on-chain transaction patterns: addresses with high direct-counterparty volume to known Binance Cold wallets, confidence 0.78–0.92. Methodology see
audit/exchange-identification.md.
Total: 12 Binance addresses, average confidence 0.89.
Filters Applied
- Self-Sends excluded — operational change-output sweeps (sender = recipient) don't represent real reserves change. Auto-filtered by the in/not-in logic of inflow/outflow definitions.
- Internal Transfers excluded — BTC moving between two identified Binance addresses doesn't change Binance's total reserves. The query explicitly excludes these via "sender NOT IN (binance) AND recipient IN (binance)" for inflow (and mirrored for outflow).
Limitations
- Coverage is not exhaustive — Binance operates many more wallet addresses than the 12 we've identified. We see a representative subset, not Binance's total balance.
- Net-flow trends are reliable; absolute balance numbers are not. Use the chart for direction-of-flow analysis, not for "How much does Binance have on-chain?".
- Confidence < 1.0 means some attribution uncertainty. The 4 cluster-traced addresses have 0.78–0.92 confidence. If one turns out to be a non-Binance address, the per-day numbers shift by that address's share.
- Public mempool only — internal Binance transactions that never broadcast on-chain are invisible. Custodial-only-database moves don't show up.
5b. Whale SOPR — Spent Output Profit Ratio
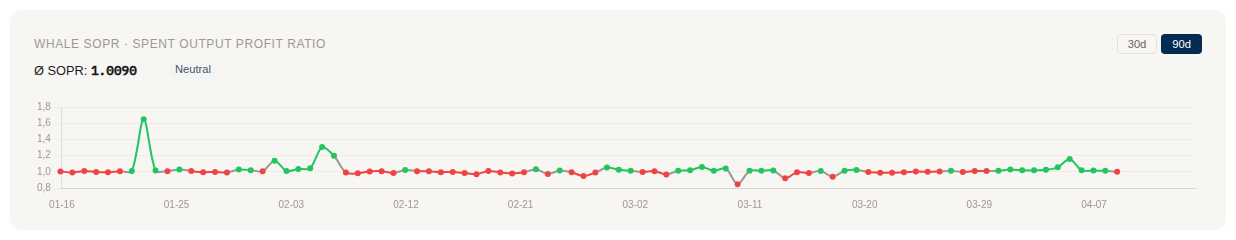
Whale SOPR: green segments = selling at profit, red = selling at loss, dashed line = breakeven
Shows whether whales are selling at a profit or loss. For each whale "sell" transaction (to exchange), the system estimates the cost basis from when that address last received BTC.
- SOPR > 1 (green) — Whales selling at profit. At extremes, this can signal market tops
- SOPR < 1 (red) — Whales selling at a loss (capitulation). Often signals bottoms
- SOPR = 1 (dashed line) — Breakeven. Acts as support in bull markets, resistance in bear markets
Signal badges: "Profit Taking" (avg SOPR > 1.02), "Capitulation" (avg SOPR < 0.98), or "Neutral". Calculated daily from whale exchange-bound transactions. Toggle 30d/90d.
Realized Profit (Bar Chart)
The green/red bars show the absolute realized profit in USD per day. This is calculated as (sell_price - buy_price) × BTC amount for each whale sell transaction.
- Green bars — Net profit day: whales realized gains selling at higher prices than their cost basis
- Red bars — Net loss day: whales sold at a loss (capitulation)
- Scale is in millions USD ($M) on the right axis
This is equivalent to Glassnode's "Realized Profit/Loss" metric (Professional tier, $39/month) — available here for free.
5c. Miner Balances — Mining Pool Holdings
Tracks BTC holdings of known mining pool addresses over time. When miners' balances decrease, it indicates outflow to exchanges or buyers. When balances increase, miners are retaining production.
- Stacked area chart — Each color represents a different mining pool (Foundry USA, AntPool, F2Pool, ViaBTC, Marathon, etc.)
- Total balance — Combined BTC holdings across all tracked pools
- Declining total — Miners are net-spending (outflow pattern)
- Rising total — Miners are net-receiving (inflow pattern)
Based on 15+ known mining pool addresses. Updated nightly. Toggle 30d/90d.
5d. HODL Waves — Whale UTXO Age Distribution
A stacked area chart showing how old the UTXOs (unspent coins) of top whale addresses are. This is the whale-focused version of Glassnode's HODL Waves indicator.
- Color bands — Each band represents an age bucket: 1 day, 1 week, 1 month, 3 months, 6 months, 1 year, 2 years, 3 years, 5+ years
- Growing older bands — Whales are increasing dormancy (HODL pattern)
- Growing younger bands — Whales are moving/spending coins (potential distribution)
Based on ~300 whale addresses with over 100 BTC in estimated holdings. Updated nightly via our Bitcoin full node's UTXO index. Toggle 30d/90d.
6. Fear & Greed Index & BTC Dominance
Two side-by-side charts that show market sentiment and asset dominance trends.
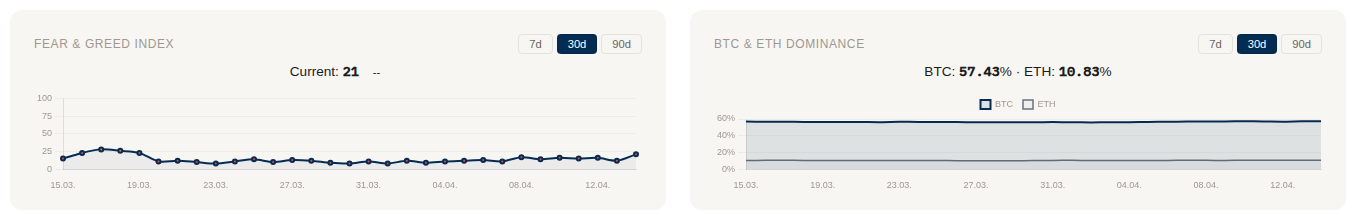
Fear & Greed Index (left) and BTC/ETH Dominance (right)
Fear & Greed Index from alternative.me — ranges from 0 (Extreme Fear) to 100 (Extreme Greed). Color-coded dots: red ≤25, orange ≤50, yellow ≤75, green >75. Toggle between 7d, 30d, and 90d.
BTC/ETH Dominance shows market share trends. BTC dominance rising often signals capital rotating from altcoins to Bitcoin (risk-off). Toggle 7d/30d/90d.
BTC & ETH Dominance — Detail
BTC and ETH dominance show each coin's share of the total crypto market cap (sourced from CoinGecko). The two values do not sum to 100% — the rest is altcoins and stablecoins. Rising BTC dominance with falling ETH dominance often coincides with risk-off rotations from altcoins to BTC. Sustained shifts of more than 5 percentage points over weeks have historically preceded broader market regime changes.
6b. Community Sentiment — Multi-Platform
Aggregated market sentiment from seven independent sources. Each post, headline, or index reading is scored on a scale from -1.0 (very bearish) to +1.0 (very bullish). The chart shows one thin line per platform plus a thick Overall line which is weighted by confidence and mention volume.
Current Value is the confidence-weighted sentiment across all platforms over the last 6 hours. The colored badge indicates Bullish (≥+0.3), Neutral, or Bearish (≤-0.3). Toggle 7d / 30d / 90d.
Sources
| Platform | What it captures | Scoring |
|---|---|---|
| Telegram | 12+ crypto channels, price discussions and commentary | LLM per message |
| r/Bitcoin, r/CryptoCurrency, r/CryptoMarkets, r/btc, r/ethtrader (hot) | LLM on headlines | |
| Bluesky | AT Protocol search for bitcoin / btc / ethereum / #crypto | LLM on posts |
| Farcaster | Warpcast public search — crypto-native social network | LLM on casts |
| News | Cointelegraph + Decrypt + Google News RSS (BTC/ETH) | LLM on headlines |
| Google Trends | Search interest, related queries, regional breakdown | rule-based |
| Fear & Greed | alternative.me daily index, normalized 0–100 → −1..+1 | deterministic |
Each source also contributes an individual confidence (0–1, lower for ambiguous or sparse data) and impact score (scaled by engagement where available). These weights flow into the Overall line.
7. Orderbook Depth & Liquidity
Live orderbook data from Binance, collected every minute. Shows bid/ask liquidity at ±1% from current price.
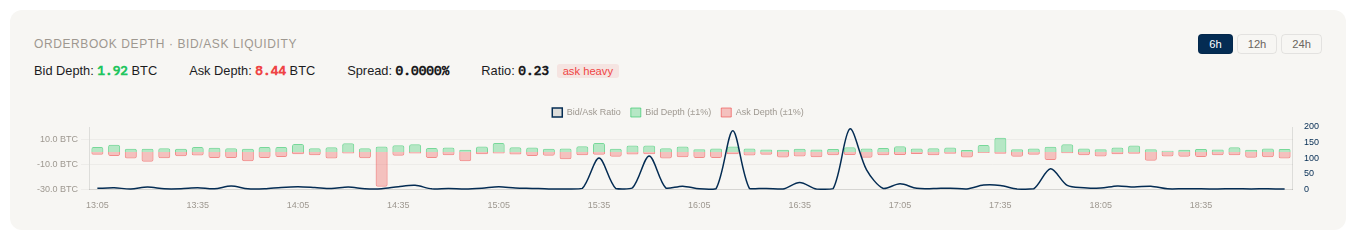
Orderbook Depth: green bars (bids), red bars (asks), ratio line
Green bars (up) = Bid depth (buy orders within 1%). Red bars (down) = Ask depth (sell orders within 1%). The blue line shows the Bid/Ask ratio. Toggle 6h, 12h, or 24h.
The summary shows: current bid/ask depth in BTC, spread percentage, and a signal badge (bid heavy / ask heavy / balanced).
8. Whale Activity Chart
Shows daily whale transaction volume (BTC) and transaction count over time. Helps you spot trends — are whales getting more active or cooling down?
Switch between 7d, 30d, and 90d timeframes. The summary line shows average daily transaction count and volume.
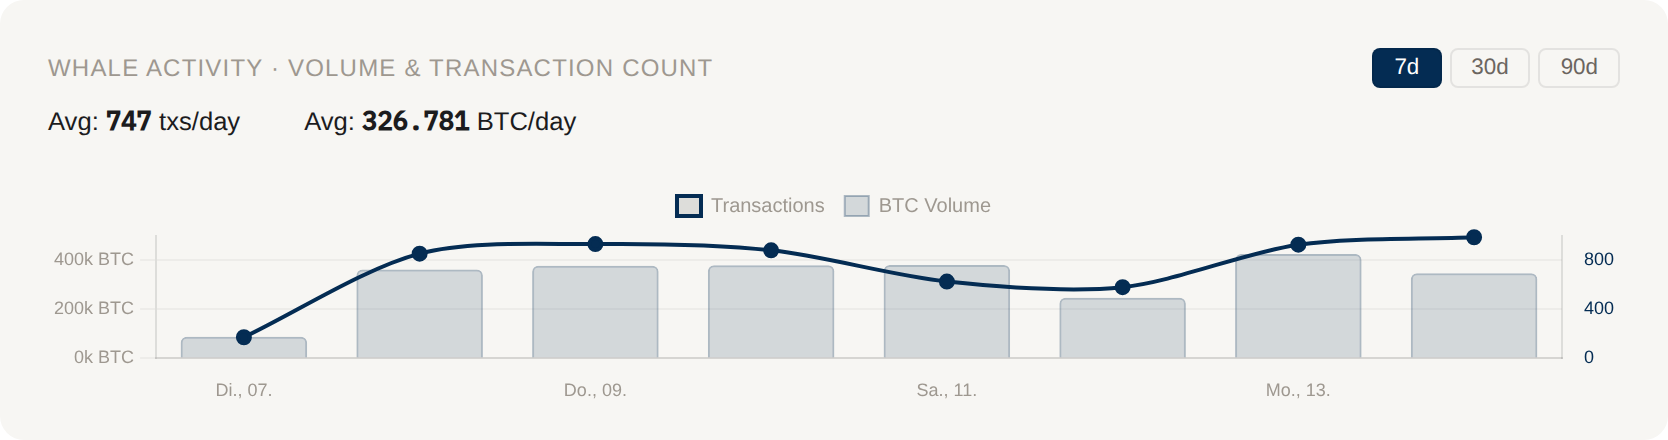
Dual-axis chart: BTC volume (bars) and transaction count (line) over 7 days
9. BTC Funding Rate & Open Interest
Live derivatives data from Binance Futures. Shows how leveraged the market is and in which direction.
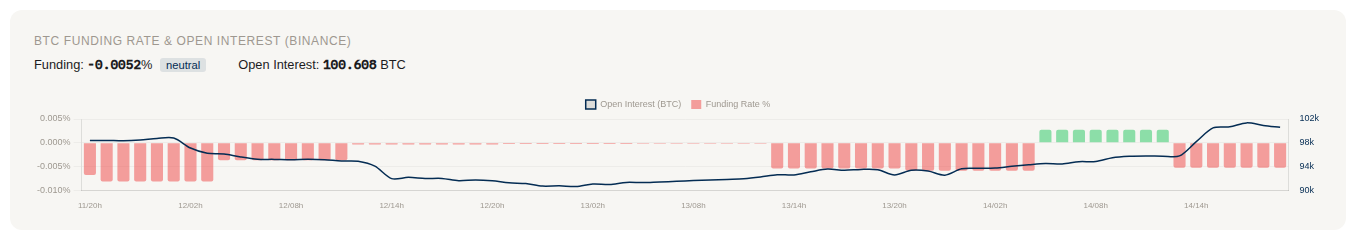
Funding Rate bars (green = positive, red = negative) + Open Interest line
Funding Rate is paid every 8 hours between longs and shorts. Positive = longs pay shorts (market is long-heavy). Negative = shorts pay longs.
Open Interest shows total outstanding futures contracts in BTC. Rising OI + rising price = strong trend. Rising OI + falling price = potential liquidation cascade.
10. ETH Whale Activity
Same dual-axis chart as BTC whale activity, but for Ethereum. Shows daily ETH whale volume (bars) and transaction count (line). Toggle 7d/30d/90d.
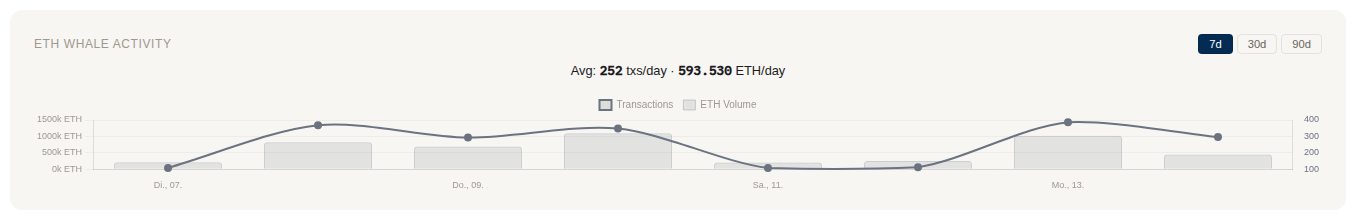
ETH Whale Activity: volume bars + transaction count line
10b. ETH Analytics — Flows, Staking, Gas & DEX
Four complementary charts that extend the ETH coverage from "whale-level activity" to full market context — analogous to the BTC on-chain suite.
ETH Exchange Flows & Reserves
Derives exchange inflows/outflows from the entity label table (~130 curated exchange addresses for Binance, Coinbase, Kraken, OKX, Bitfinex, Bybit, Gate, HTX, Upbit, Crypto.com and more). Only transactions where the counterparty is not also a known exchange are counted, so wallet rotations between exchange hot wallets don't pollute the signal.
- ETH Exchange Flows — daily inflows (red, to exchange) vs outflows (green, from exchange). Toggle 7d/30d/90d.
- ETH Exchange Reserves — cumulative net flow as a proxy for exchange balance trend. Rising = accumulation on exchanges (potential sell pressure); falling = withdrawals (potential hodling). Toggle 30d/90d/1y.
ETH Staking Pool Balances
Daily snapshot of ETH held by the largest liquid staking and CEX staking protocols. Source: DeFiLlama TVL / live ETH price. Tracked: Lido, Binance Staked ETH, ether.fi, Rocket Pool, StakeWise, Renzo, Coinbase cbETH, Frax Ether, and more as they become available. This is the ETH analogue to Miner Balances for BTC.
ETH Gas & DEX Volume
Dual-axis chart combining fast gas price (gwei, Blocknative API) with daily DEX volume (aggregate of Uniswap, Curve, 1inch, Balancer etc. via DeFiLlama). Gas spikes align with periods of high DeFi activity; persistent low gas often signals market-wide cooldown. Toggle 24h/72h/7d.
11b. Dashboard Personalization — Layout & Custom Tickers
Floating Layout (Drag & Collapse)
Click ✎ Edit layout in the header to enter layout-edit mode. In this mode:
- Drag any chart card to a new position — reorder top-level cards or within 2-column rows.
- Hover any card (no edit mode needed) to see a small − button: click to collapse the chart body to just its title. Click again to expand.
- Click ↺ Reset to restore the default layout and re-expand all cards.
The layout (both card order and collapsed state) is saved in your browser's localStorage. No server sync — layouts are device-specific, which means you can have different setups on desktop vs mobile.
Custom Tickers — Live Mini-Widgets
Above the stats row you'll find the My Tickers bar. Click + Add Ticker to create a live indicator card. Available types:
| Type | What it shows |
|---|---|
| Price Pump / Dump | BTC price delta % in N hours vs your threshold |
| Whale Inflow / Outflow | Summed exchange flows (BTC) in N hours |
| Fear & Greed Extreme | Trigger when index ≤ below or ≥ above |
| Sentiment Extreme | Community sentiment score from any of the 7 platforms (6h window) |
| Dormant Whale Awaken | Count of N-year-dormant wallets that moved in 24h |
| Address Activity | Minutes since last TX for a watched BTC address |
Each ticker shows a color-coded status: 🔥 triggered, ⚠ warning (close to threshold), ✓ OK, or — inactive. Values refresh every 30 seconds. Click any ticker to edit or delete it.
Telegram Integration
Tickers share the same rule engine as Telegram /track alerts. Every ticker you create on the dashboard also generates a push notification when triggered (Premium / Trial users). Conversely, you can make any Telegram /track rule visible as a dashboard ticker:
/track pump 2 1h          # create alert (Telegram only)
/mytracks                 # see all rules with their IDs
/track dashboard 5 on     # also show rule #5 as a dashboard ticker
/track dashboard 5 off    # hide from dashboard (Telegram alert stays active)
11. Multi-Coin Overview
At-a-glance view of 16 major cryptocurrencies with current price, 24h change percentage, and a mini sparkline showing the 24h price trend.
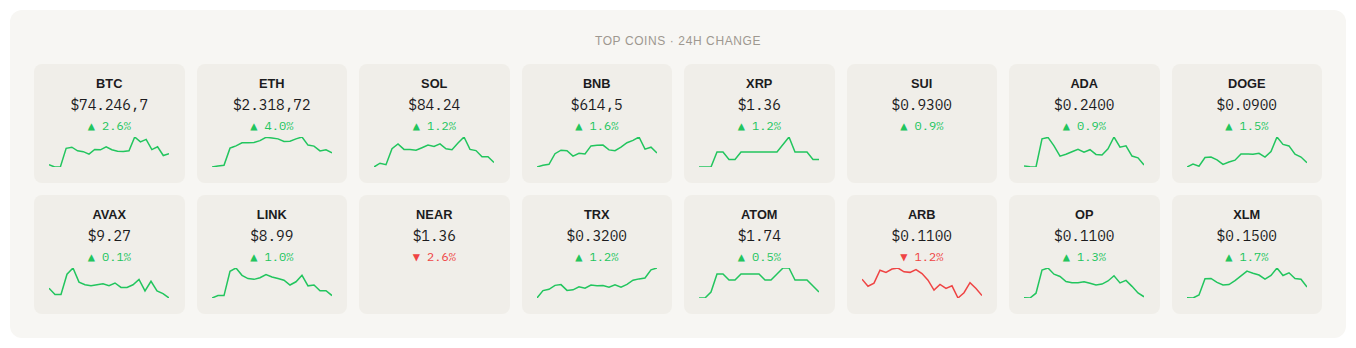
16 coins with price, 24h change, and sparkline
Green arrows and sparklines indicate positive 24h performance, red indicates negative. Coins tracked: BTC, ETH, SOL, BNB, XRP, SUI, ADA, DOGE, AVAX, LINK, NEAR, TRX, ATOM, ARB, OP, XLM.
12. Live Whale Feed — Free vs. Premium
The main data table is where Free and Premium diverge most. Here's a direct comparison:
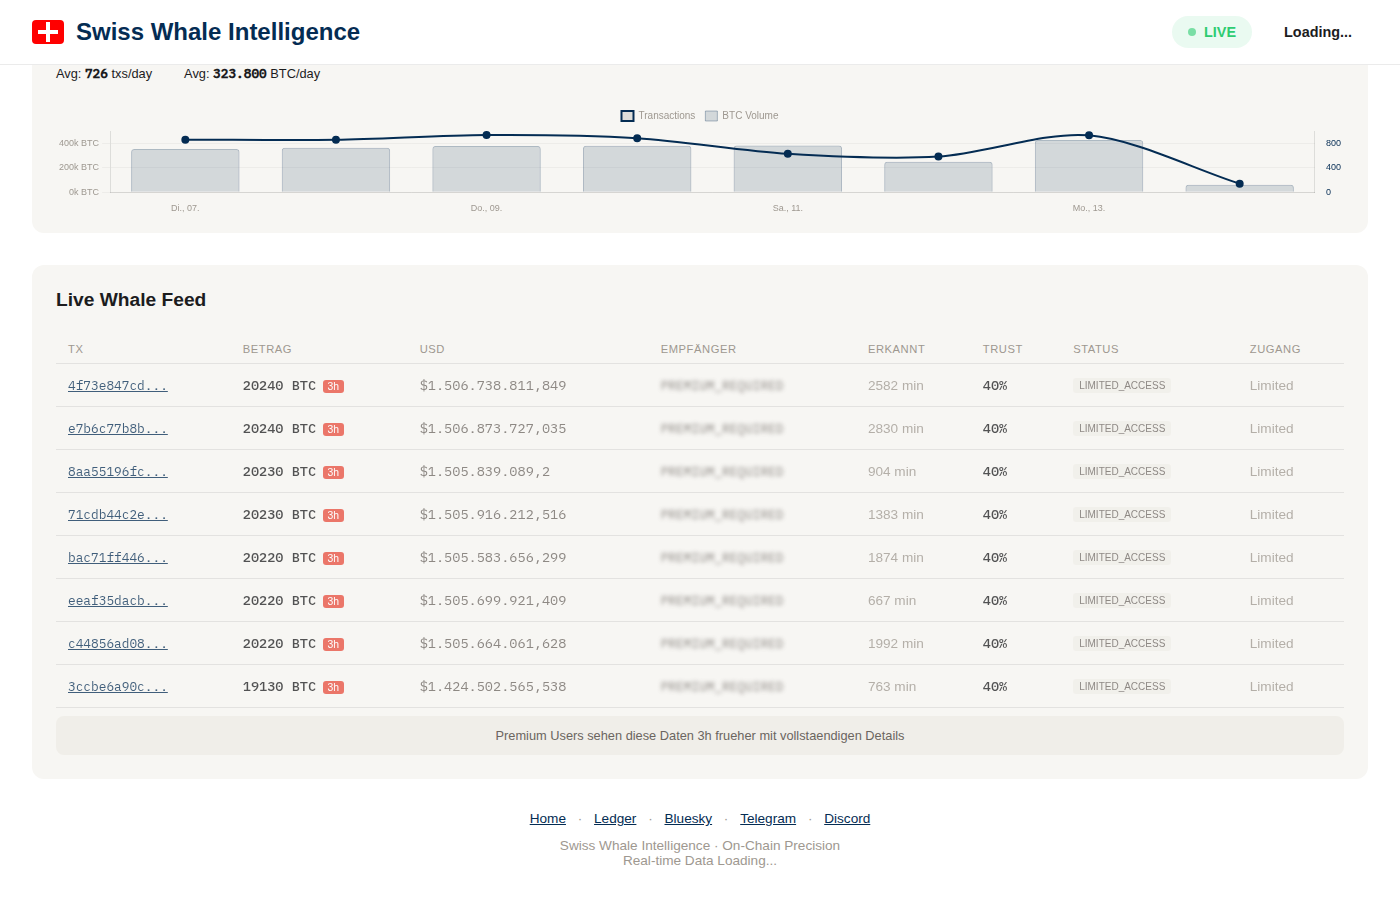
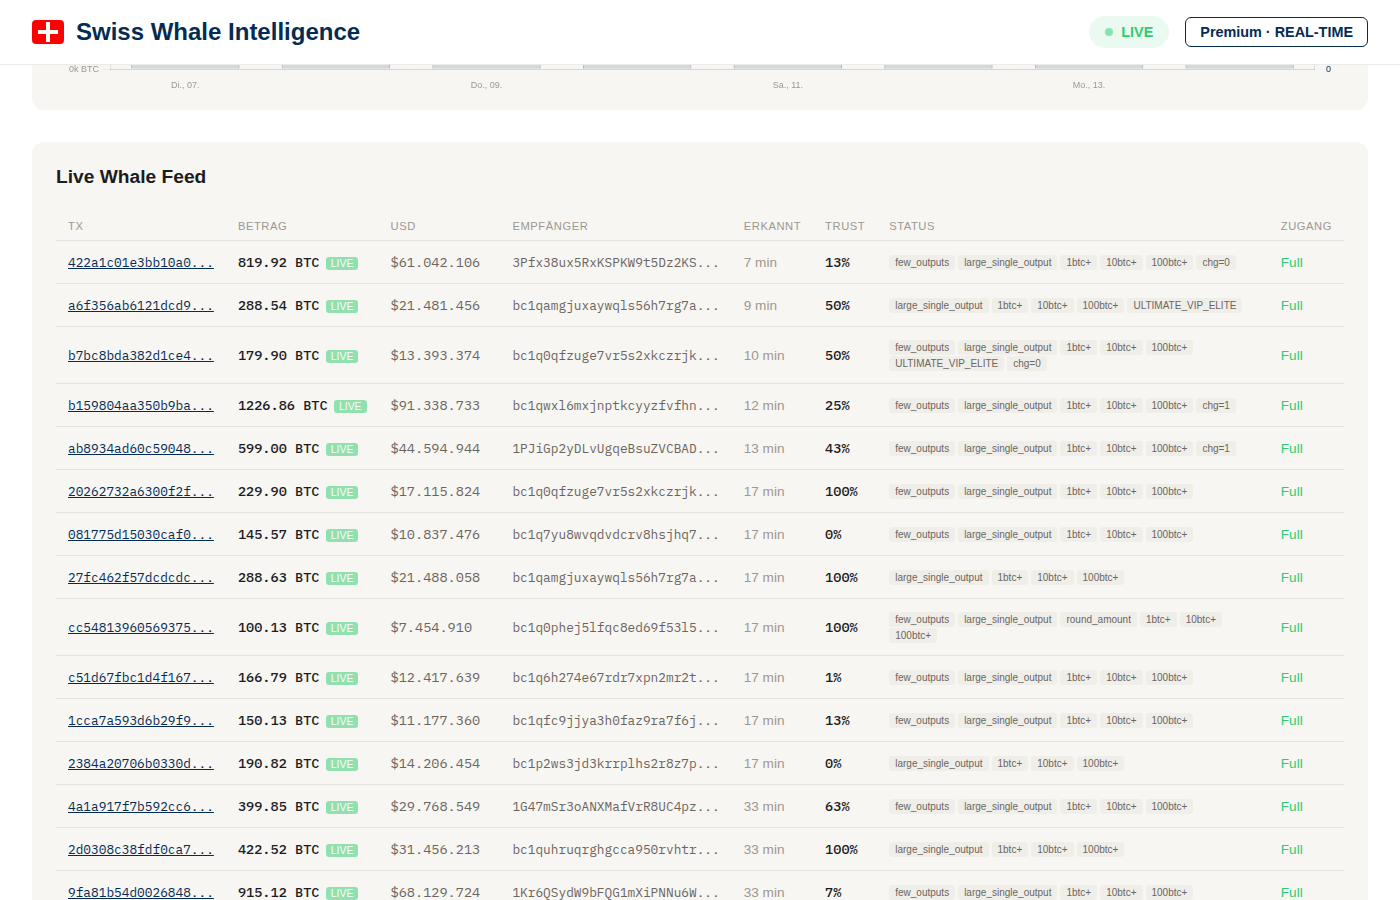
Free: masked addresses, rounded amounts, 3h delay. Premium: full addresses, exact amounts, real-time.
Updated table layout with clickable TX links, entity labels, flow type tags, and volume indices
Feed Columns Explained
| Column | Description |
|---|---|
| TX | Transaction ID — clickable link to the detail page |
| BTC / USD | Amount in BTC and USD value. Premium: exact. Free: rounded. |
| Sender / Recipient | Bitcoin addresses. Premium: full addresses. Free: partially masked. |
| Comment | Auto-generated context: confirmations, block time, flow info |
| Volume | Volume Index (0–100%) — how well-known this address is |
| Status | Flow type tags: from_exchange, to_exchange, wallet_to_wallet, etc. |
| Detail | Link to full analysis page (Premium: signed link with price window, related TXs) |
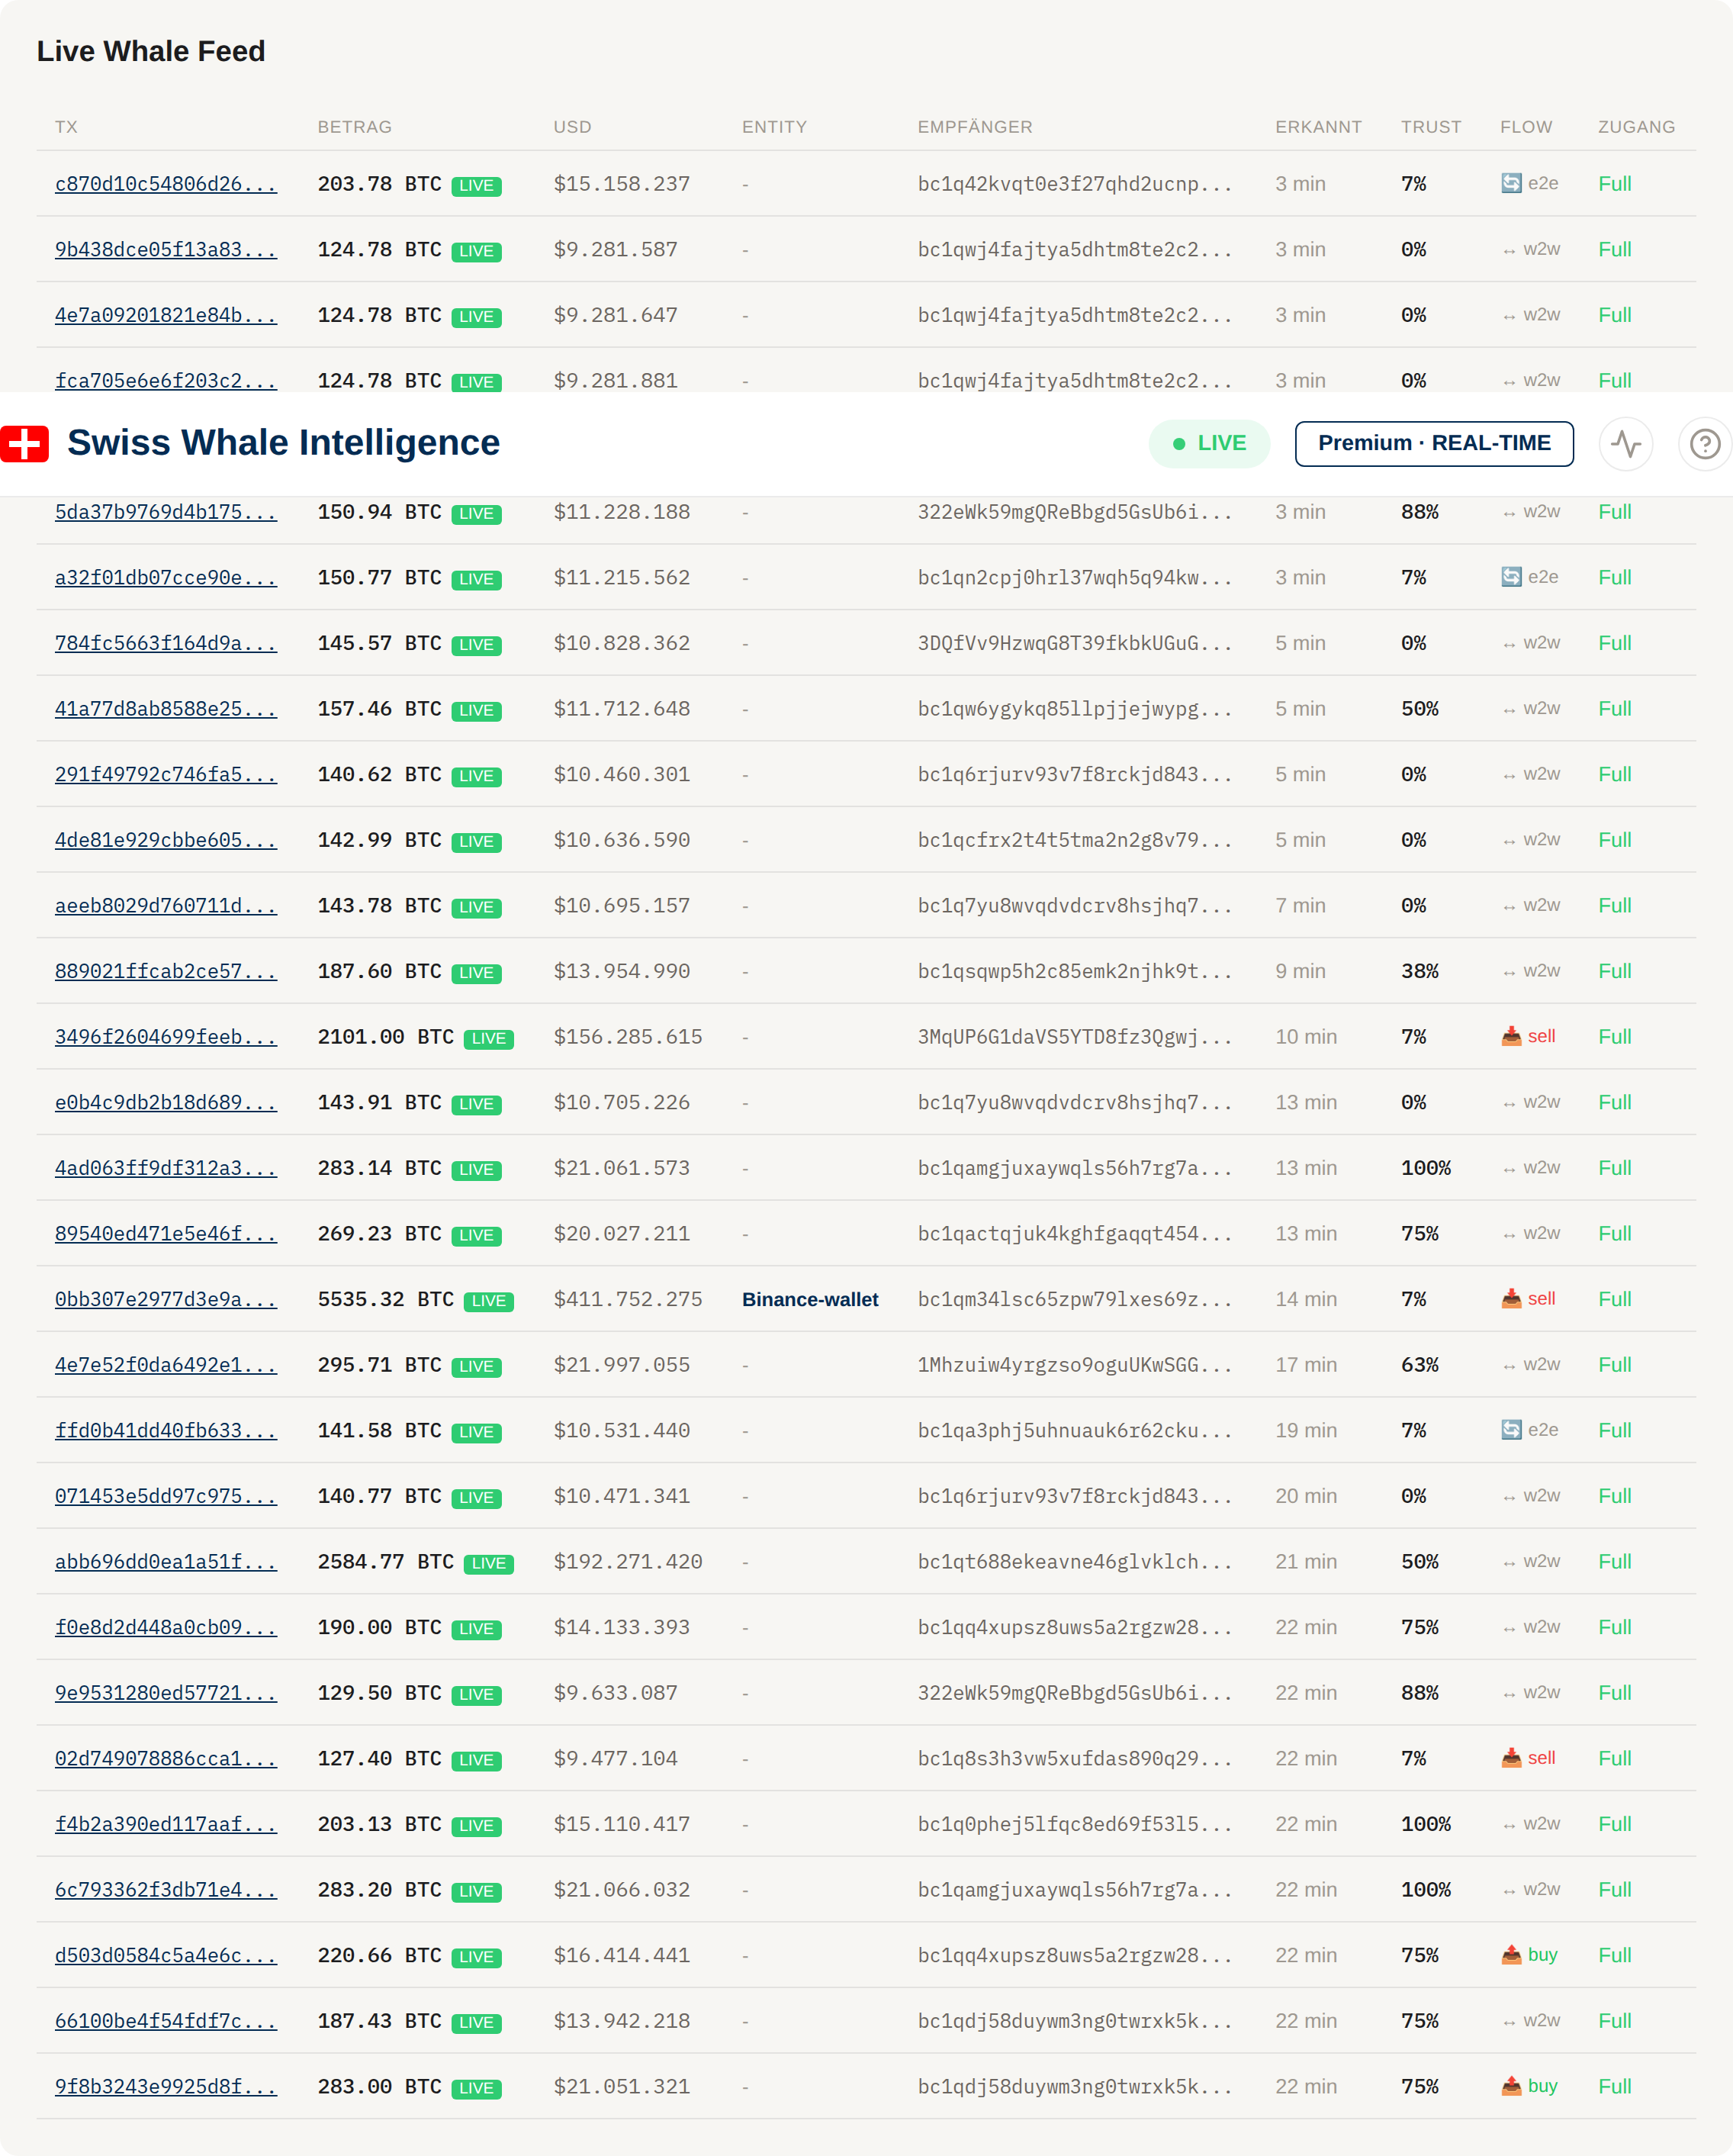
Premium Feed in Detail
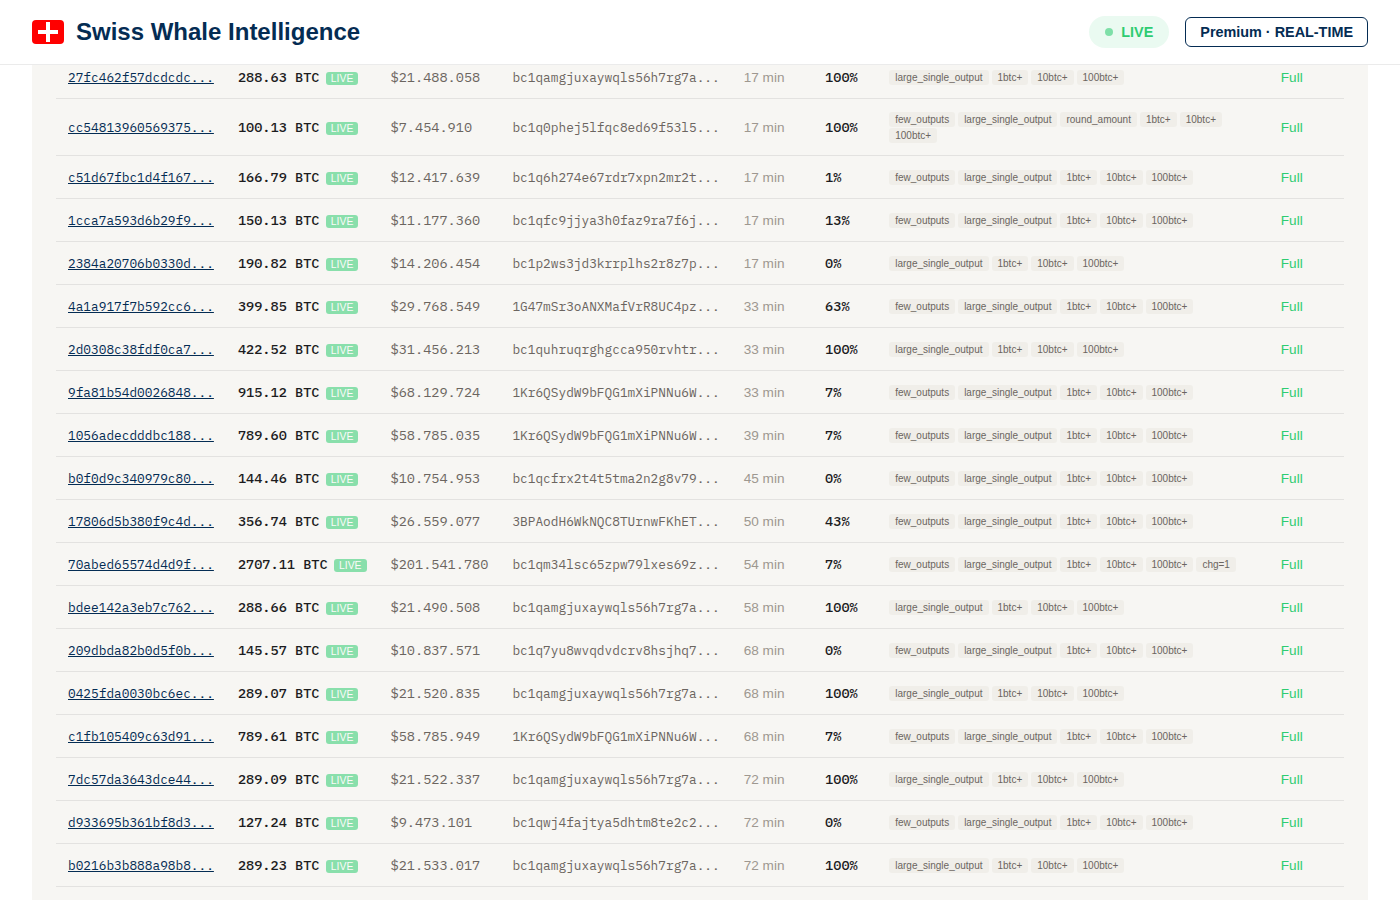
Premium feed: full addresses, exact BTC amounts, volume indices, flow types, and clickable analysis links
Flow Type Categories
Each whale transaction is classified by direction:
to_exchange— BTC sent to a known exchange address (often labeled selling pressure).from_exchange— BTC withdrawn from an exchange (often labeled accumulation).wallet_to_wallet— transfer between non-exchange addresses (OTC, cold storage rotation).exchange_to_exchange— inter-exchange transfer (market makers, custody rotation).self_send— internal change-output sweep (same address as sender and recipient — operational, not a real cross-address flow, excluded from headline counters).
The Flow Types donut on the dashboard shows the distribution of these categories over the selected window.
13. Transaction Detail Pages Premium
Premium users get signed links from the whale feed that open a comprehensive analysis page for each transaction. These pages pack a lot of information:
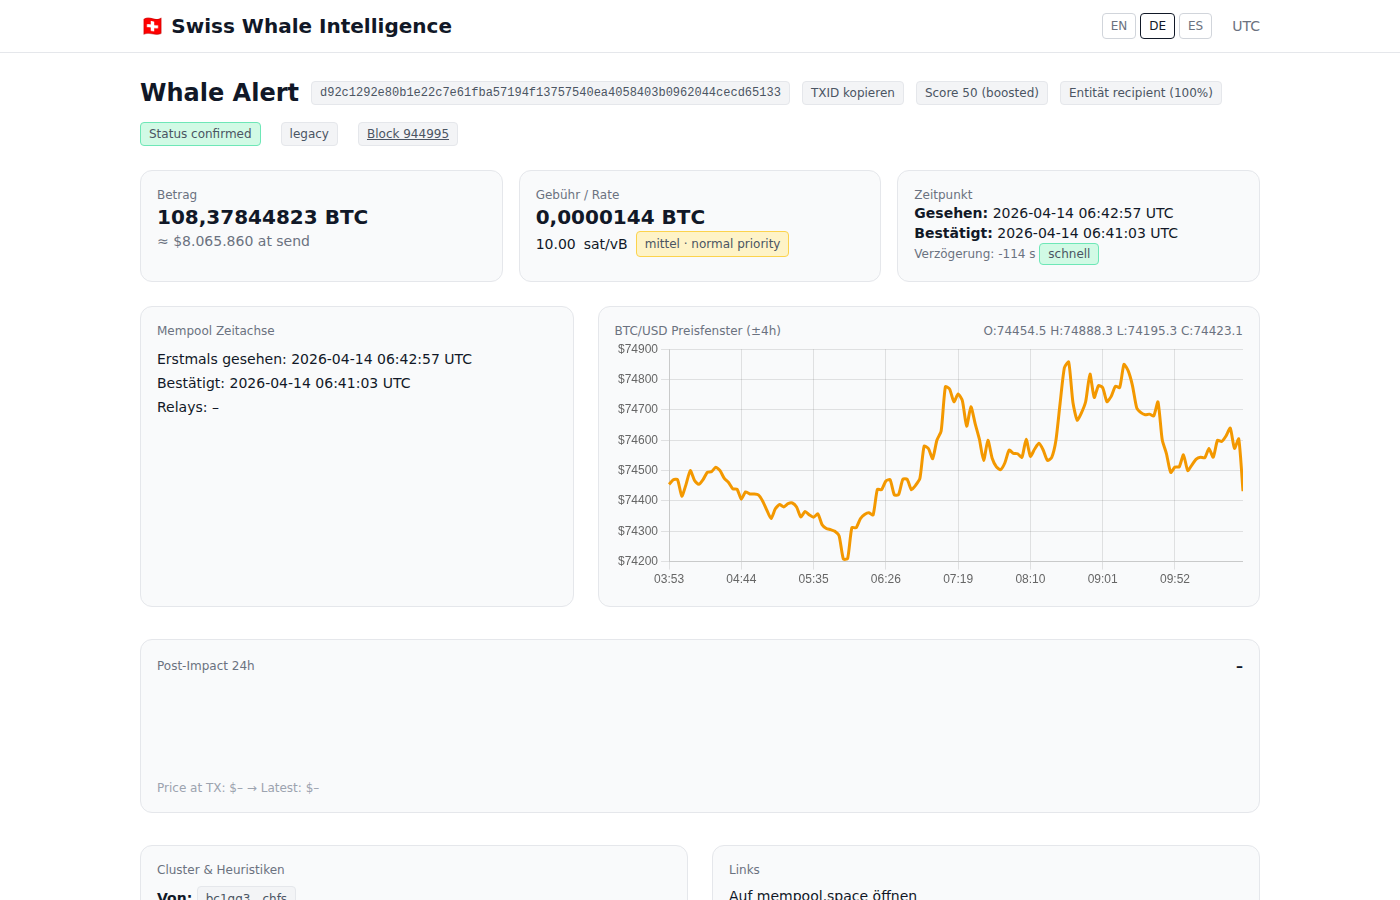
Full alert page: header badges, amount, fee rate, timing, mempool timeline, and price window chart
Header & Badges
The top of every alert shows the full TXID (with a copy button), plus status badges:
- Status confirmed / unconfirmed — Whether the TX is included in a block
- Score — Quality score (0–10) based on amount, Volume Index, and flow significance
- Entity recipient — Confidence percentage that the recipient is a known entity (e.g. exchange). Hover for a detailed explanation of how the confidence is calculated (address reuse patterns, transaction graph clustering, known exchange databases)
- Block number — Clickable link to the block explorer (see below)
Info Cards
Amount
Exact BTC amount + USD value at the time of broadcast.
Fee / Rate
Transaction fee in sat/vB with an interpretation badge: low · planned move (<8 sat/vB), medium · normal priority (8–20), or high · urgent (>20). Hover the badge for a detailed tooltip explaining the thresholds.
Timing
When the TX was first seen in the mempool and when it was included in a block, plus the delay between the two.
Mempool Timeline
Visual timeline showing first-seen vs. included timestamps.
BTC/USD Price Window
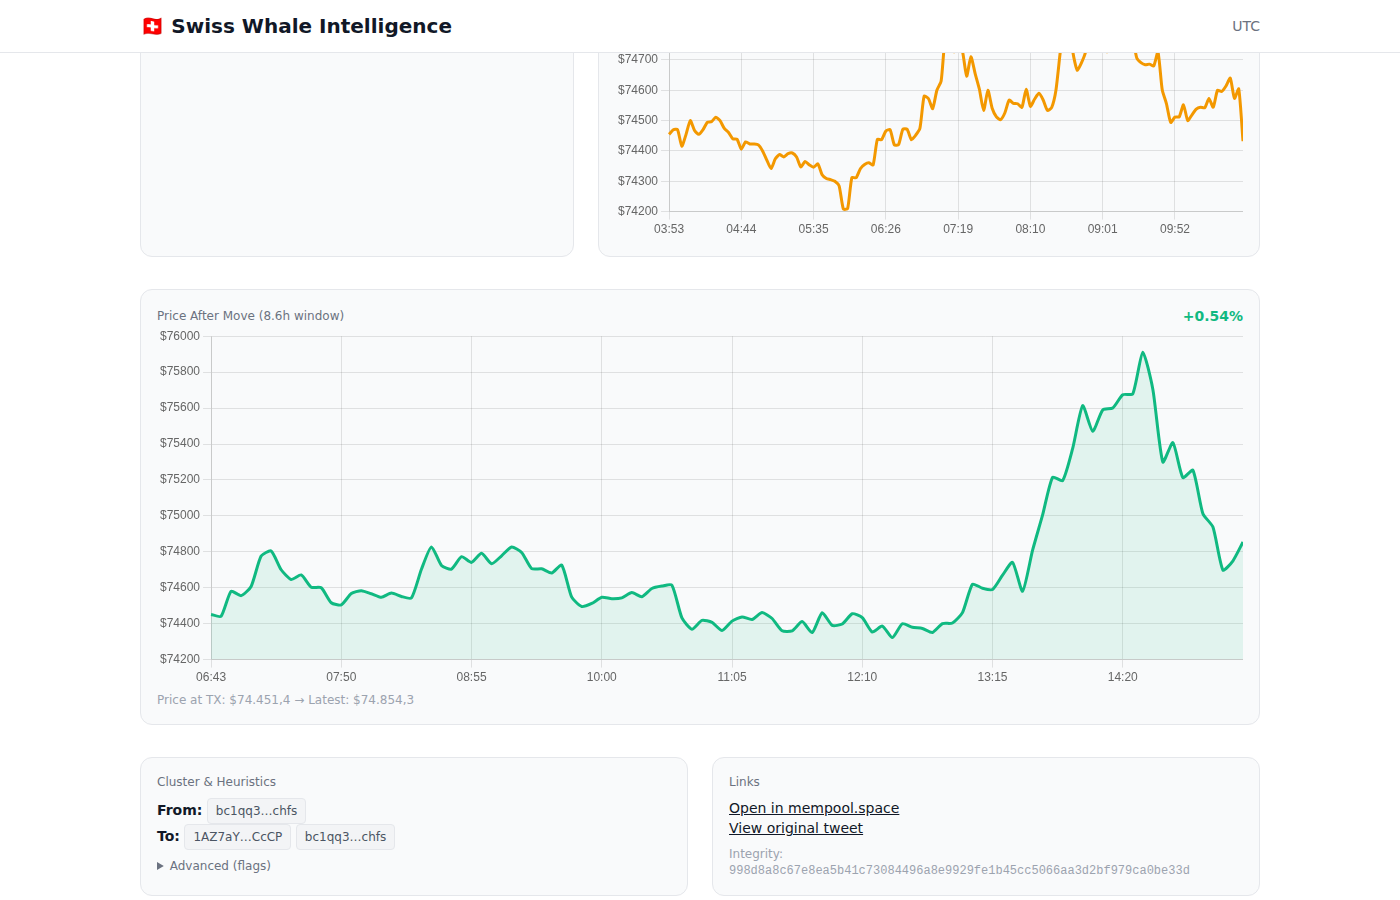
Price window (±4h), post-impact chart (+24h), cluster & heuristics, and external links
A ±4 hour price chart centered on the transaction time with OHLC data (Open, High, Low, Close). This lets you see exactly where in the price action the whale made their move.
Price After Move (Post-Impact)
Below the main price chart, a second chart shows the 24 hours after the transaction. This answers the key question: did the price go up or down after this whale moved?
- Green chart — Price increased after the move (positive return)
- Red chart — Price decreased after the move (negative return)
- Shows exact percentage return (e.g.
+4.91%), price at TX time, and latest price - Only visible for transactions older than a few hours (needs post-move price data)
On-Chain Balance
For addresses that our Bitcoin full node can resolve, the alert page shows real-time UTXO balance data for both sender and recipient:
- Balance — Current confirmed BTC balance of the address
- UTXO Count — Number of unspent transaction outputs (fewer = more consolidated wallet)
- Transaction Count — Total number of on-chain transactions for this address
This data comes directly from our local electrs UTXO index connected to our Bitcoin full node — no third-party API, no delays.
Cluster & Heuristics
Shows the sender and recipient addresses with known labels. The Advanced (flags) section can be expanded for additional transaction metadata and technical flags.
External Links
- Open in mempool.space — View the full TX on the mempool.space block explorer
- View original tweet — Link to the original alert post (if one was published)
- Integrity hash — SHA-256 hash for data verification
Similar Recent Alerts
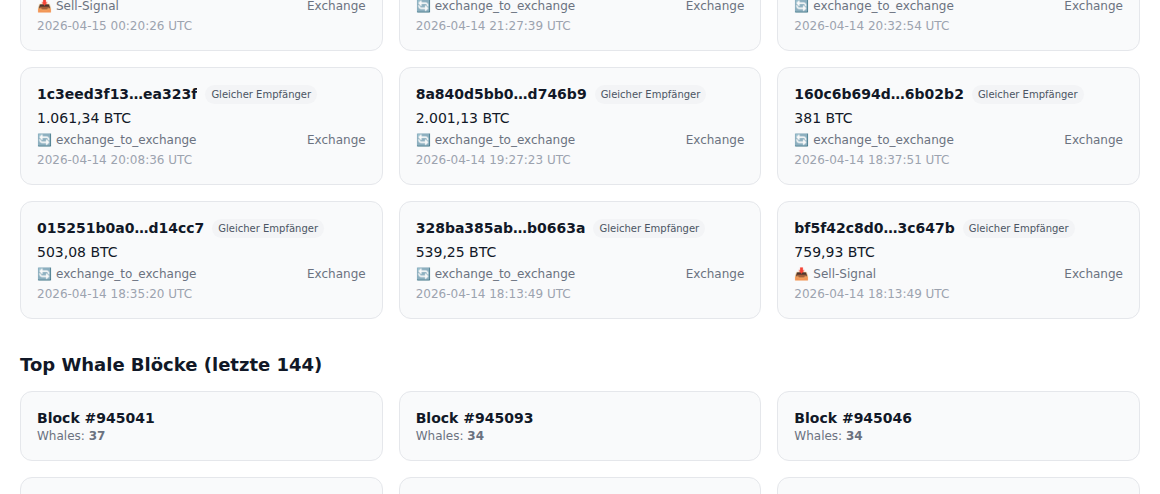
Related whale transactions from the same sender or recipient within 90 days
Shows whale transactions involving the same sender or recipient within a 90-day window. Each card displays:
- Match type badge — "Same sender", "Same recipient", or "Same pair" (both match)
- Flow type — Outflow (from exchange), Inflow (to exchange), or Wallet→Wallet
- Entity label — Exchange name (Binance, Coinbase, etc.) when identified
- On-chain history — Additional transactions from our Bitcoin full node (via electrs UTXO index)
This helps you identify patterns: is this a one-off move, or does this whale regularly transact? Are the flows consistently in one direction?
Top Whale Blocks
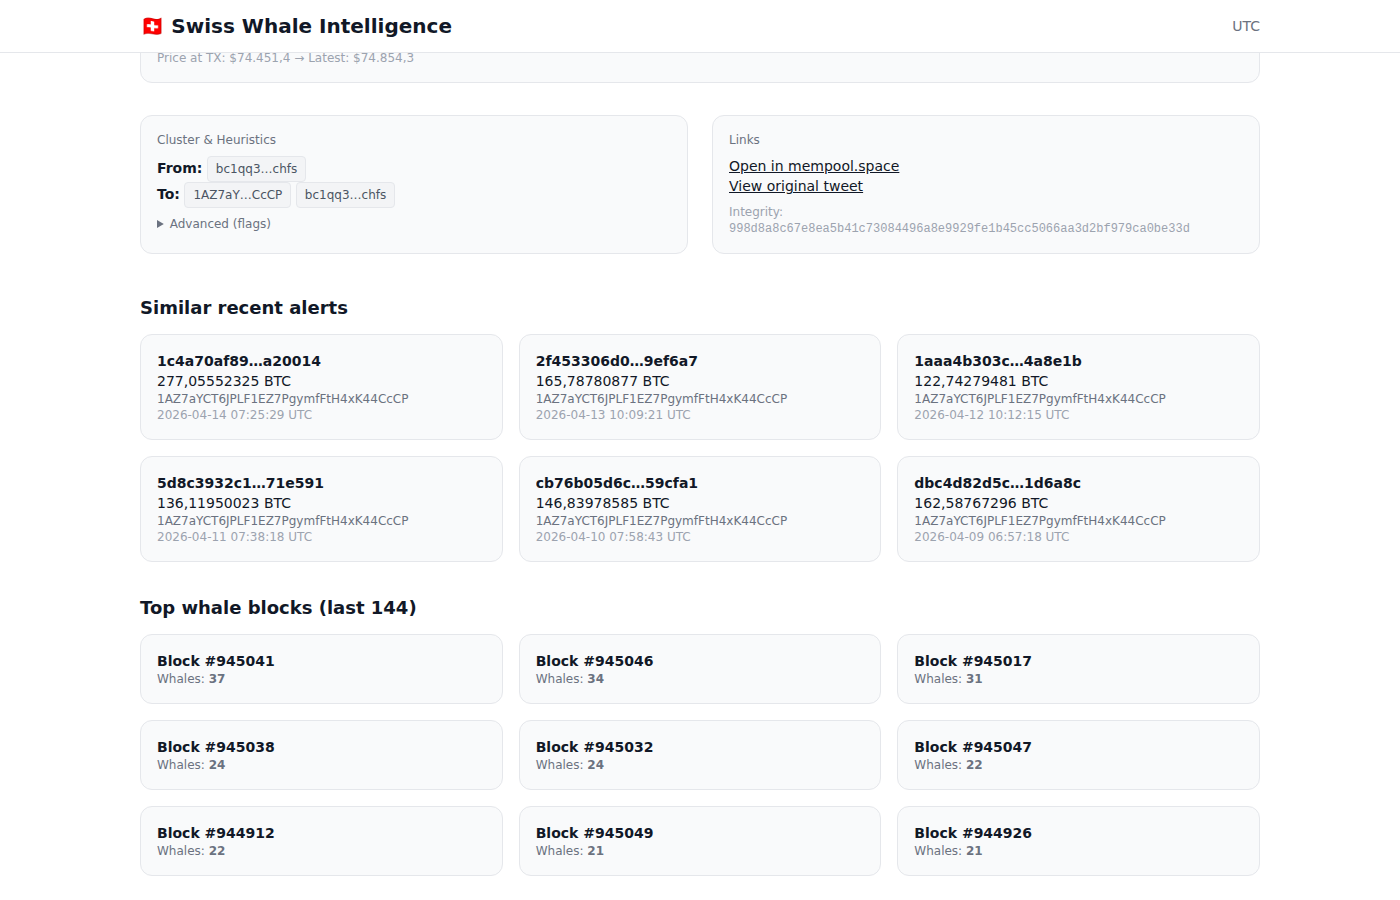
Blocks with the most whale transactions in the last ~24 hours
Lists the blocks with the most whale transactions in the last 144 blocks (~24 hours). Click any block to open the block explorer modal.
14. Block Explorer Premium
Clicking a block number anywhere on the alert page opens an interactive block explorer modal:
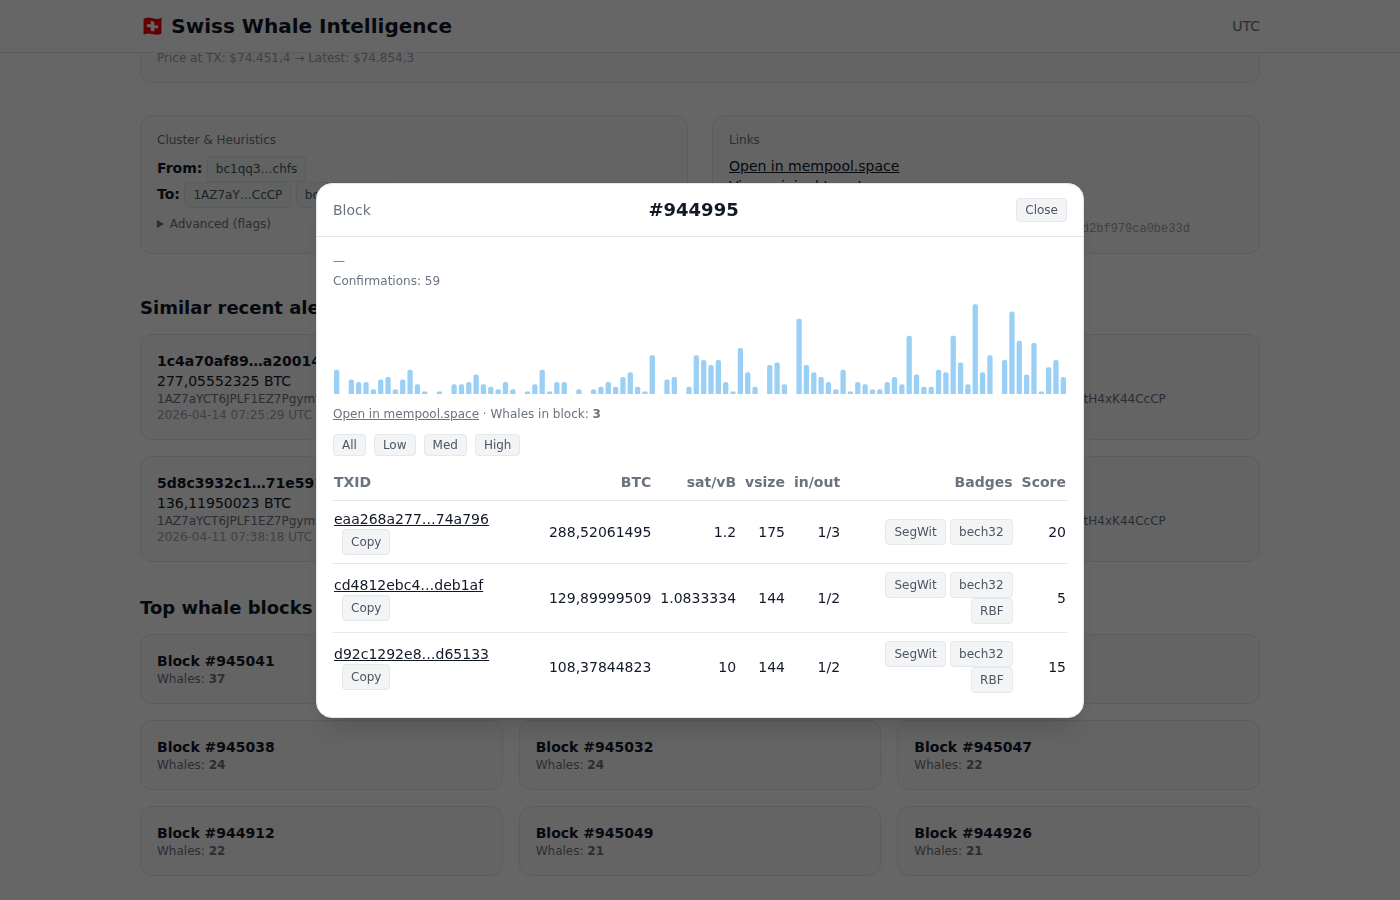
Block modal: confirmations, fee rate histogram, and all whale transactions in the block
What the Block Explorer Shows
- Confirmations — Current confirmation count
- Fee Rate Histogram — Visual distribution of fee rates across all transactions in the block
- Whales in Block — Count of whale transactions detected in this block
- Filter buttons — Filter whale transactions by fee rate: All, Low, Med, High
Whale Transaction Table
Every whale transaction in the block is listed with:
| Column | Description |
|---|---|
| TXID | Clickable transaction ID + copy button |
| BTC | Exact BTC amount |
| sat/vB | Fee rate in satoshis per virtual byte |
| vsize | Virtual transaction size in bytes |
| in/out | Number of inputs and outputs |
| Badges | Technical badges: SegWit, bech32, legacy, RBF (Replace-by-Fee) |
| Score | Quality score (0–10) |
The block explorer also links to mempool.space for the full block view.
15. Whale Address Profiles Premium
Premium users can access detailed profiles for individual whale addresses, linked from transaction detail pages.
Volume Index
The Volume Index (0–100%) measures how well-known an address is, based on transaction history, exchange-cluster association, and pattern analysis. Higher scores mean familiar/labeled addresses (exchanges, custodians, miners). Lower scores indicate uncatalogued addresses. Note: Volume Index is a measure of identification confidence — not of profitability. Well-known whales are typically already priced in by the market.
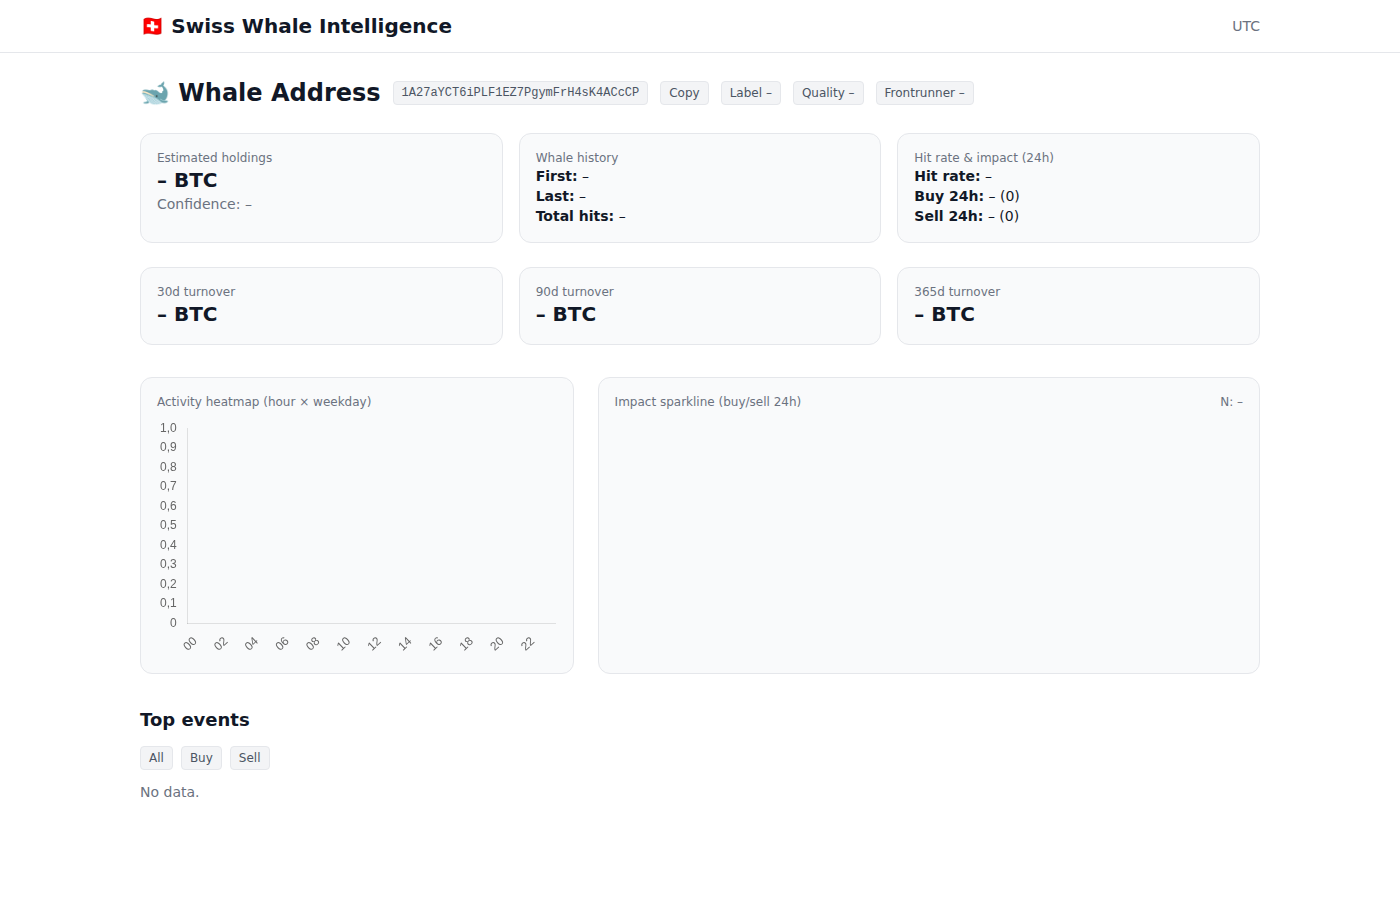
Whale address profile: holdings, history, hit rate, turnover, activity heatmap, and top events
Profile Overview Cards
Estimated Holdings
Estimated current BTC balance based on on-chain data, with confidence level.
Whale History
First and last seen dates, total number of whale-sized transactions (hits).
Hit Rate & Impact
Historical hit rate and 24h buy/sell activity count.
Turnover (30d / 90d / 365d)
Total BTC volume moved by this address in different timeframes.
Activity Heatmap
A hour-of-day vs. day-of-week heatmap showing when this address is most active. Useful for identifying routine transfers (e.g. daily at 15:00 UTC) vs. irregular activity.
Whale Fingerprint
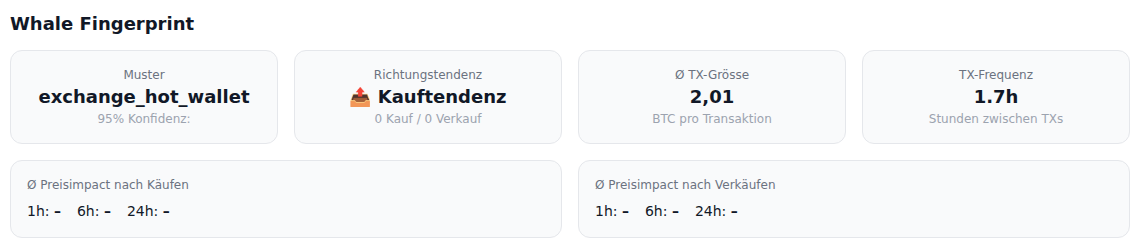
Whale Fingerprint: behavioral pattern, direction bias, average TX size, and transaction frequency
A behavioral profile section that reveals how this whale typically operates:
Pattern Type
Classified as Accumulator, Distributor, Mixed, or Neutral based on historical flow analysis.
Direction Bias
Buy vs. sell ratio showing whether this address predominantly accumulates or distributes BTC.
Avg TX Size
Average BTC per transaction, revealing whether this is a retail whale or institutional-scale.
TX Frequency
Average time between transactions — hourly routine or monthly large moves?
Below the pattern cards, average price impact tables show what typically happens to BTC price 1h, 6h, and 24h after this whale buys or sells. Green values indicate price increases, red indicates drops.
Realized Value & MVRV
A Glassnode-style per-address MVRV analysis using real UTXO data from our Bitcoin full node:
- Avg cost basis — The average price this whale paid for their BTC, calculated from UTXO creation timestamps
- Realized value — Total USD value at the time each UTXO was acquired
- Market value — Current USD value of all holdings at today's price
- MVRV ratio — Market / Realized. Above 1.0 = sitting on profit (green), below 1.0 = underwater (red)
- Unrealized P&L — Percentage profit or loss vs. cost basis
This reveals whether a whale is likely to sell (high MVRV = large unrealized profit) or hold (low MVRV = would sell at a loss).
Impact Sparkline
A sparkline comparing buy vs. sell price impact across 1h, 6h, and 24h timeframes.
Top Events
The largest transactions from this address, filterable by Buy/Sell, with BTC amounts and timestamps.
Address Actions
The profile header includes buttons to copy the address, set a label, adjust quality rating, and mark as frontrunner for monitoring.
16. Public Transaction Pages Free
Every whale transaction also has a public page at /tx/<txid>, accessible without login:
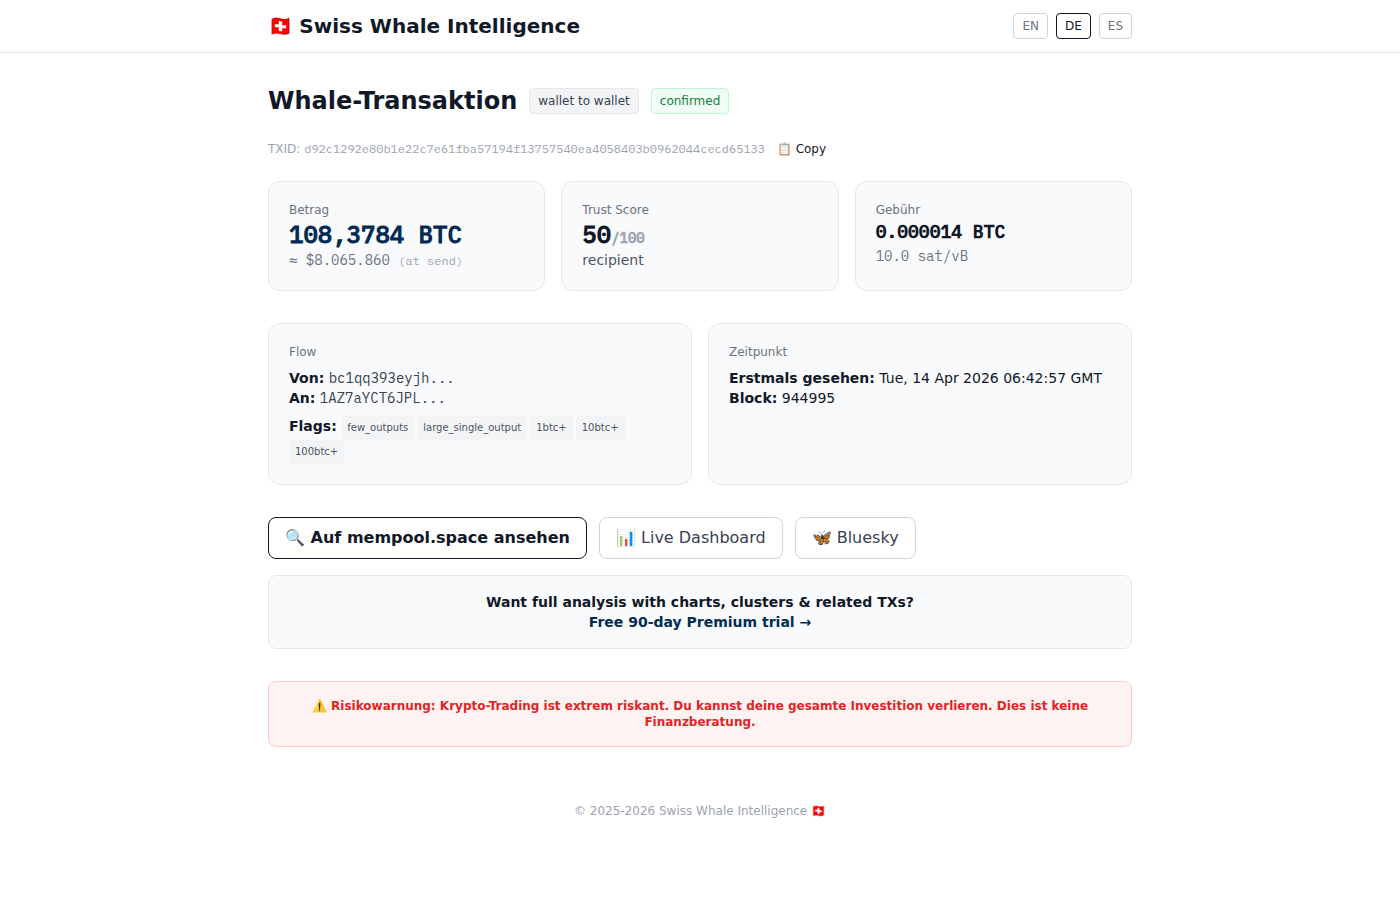
Public TX page: flow type, amount, fee, addresses, and links to mempool.space and dashboard
The public page shows:
- Flow type badge (wallet-to-wallet, to-exchange, from-exchange)
- BTC amount, score, and fee rate
- Sender and recipient addresses
- Block height and first-seen timestamp
- Links to mempool.space, the live dashboard, and Bluesky
17. BTC Indicator Charts Free
The /charts page provides Bitcoin on-chain indicators powered by our own price database (7.5M+ datapoints since 2009). Click the chart icon () in the dashboard header to access it.
Pi Cycle Top Indicator
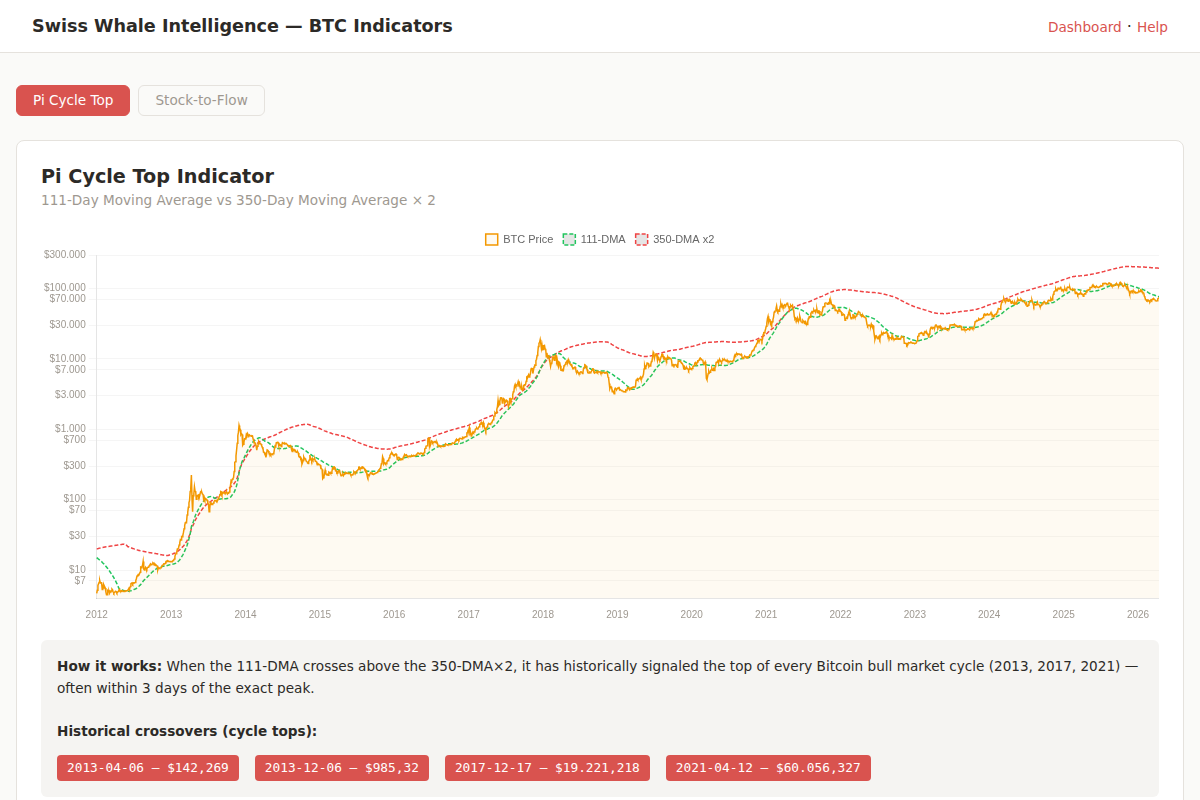
Pi Cycle Top: 111-DMA (green) vs 350-DMA×2 (red) on logarithmic scale
Plots the 111-day moving average against the 350-day moving average × 2 on a logarithmic price chart. When the 111-DMA crosses above the 350-DMA×2, it has historically signaled the exact top of every Bitcoin bull cycle:
- April 2013 — $142
- December 2013 — $985
- December 2017 — $19,221
- April 2021 — $60,056
The page shows the current gap between the two lines. A large gap means we are far from a cycle top; as the gap approaches 0%, caution is warranted.
Stock-to-Flow Model
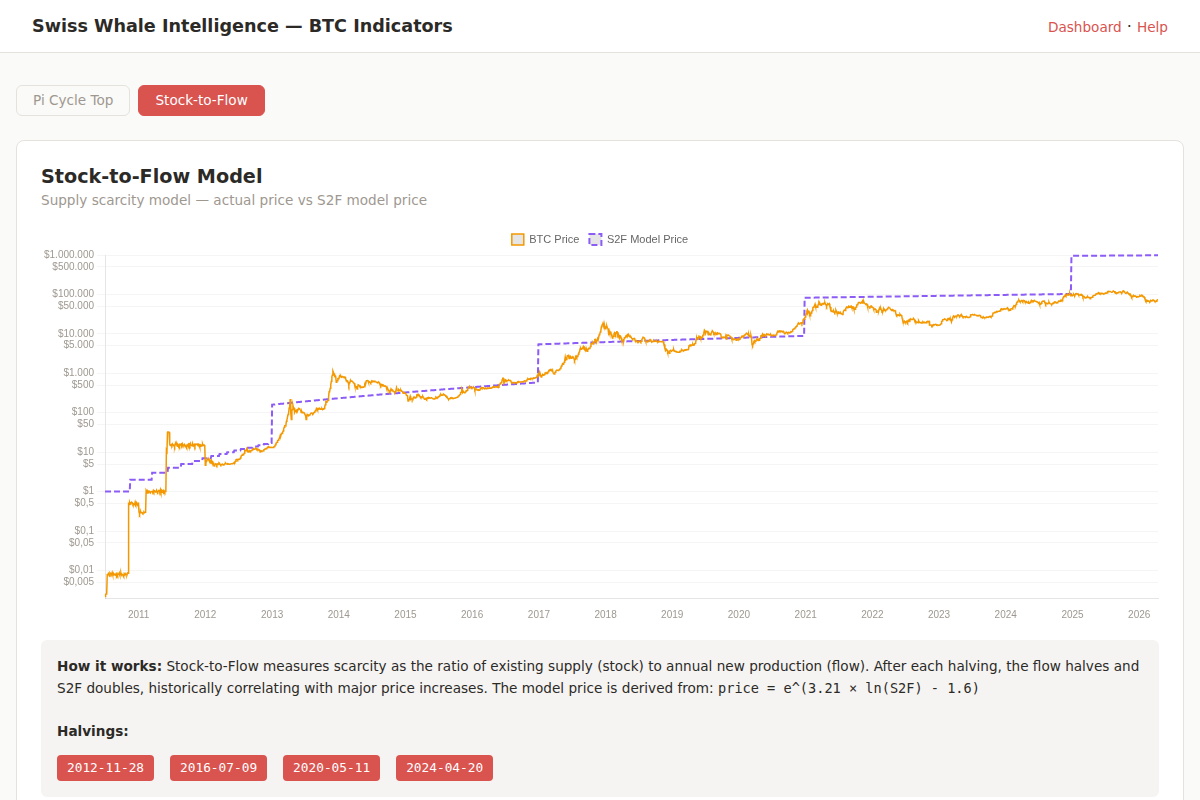
Stock-to-Flow: actual price (orange) vs model price (purple) on logarithmic scale
Measures Bitcoin’s scarcity by comparing existing supply (stock) to annual new production (flow). After each halving event, the flow halves and the S2F ratio doubles. The model price is calculated as:
price = e^(3.21 × ln(S2F) - 1.6)
The chart shows the actual BTC price against the S2F model price on a logarithmic scale. When the price is below the model line, S2F considers Bitcoin undervalued; above it, overvalued.
BTC vs Traditional Assets Free
Cumulative-return overlay comparing Bitcoin against the assets a private banker would actually compare it to: S&P 500 (SPY ETF, total return), Gold (GLD ETF), US Total Bonds (AGG ETF), NASDAQ, the raw S&P 500 index (price-only, no dividends), and a synthetic 70/30 portfolio (70% SPY + 30% AGG, monthly rebalanced — the standard conservative-investor baseline).
All series are normalized to 100 at the start of the selected window. A line at 130 means +30% cumulative. Period toggle lets you compare 90 days, 1 year, 3 years, 5 years, or max (since 1993 for the S&P).
This is intentionally an honest comparison: we publish BTC’s actual performance versus traditional assets without cherry-picking. Past observations only — not a forecast or trading signal.
Data sources: ETF prices from Yahoo Finance via yfinance (daily close, dividend-adjusted total return for ETFs). BTC from our own minute-resolution price database. The raw S&P 500 index (^GSPC) is shown separately so you can see the dividend-adjustment delta.
18. Personalized Alert Tracker Premium
Premium users can set up custom alert rules via the Telegram Bot. When an event matches your rule, you get an instant push notification.
Available Trackers
| Command | What it does | Latency | Example use |
|---|---|---|---|
/track inflow 1000 | Alert when ≥1000 BTC flows TO an exchange | ~3s | Whale selling pressure |
/track outflow 500 | Alert when ≥500 BTC leaves an exchange | ~3s | Accumulation signal |
/track address bc1q... | Alert when a specific address transacts | ~3s | Watch a known whale |
/track dormant 3 | Alert when a wallet dormant ≥3 years moves | ~10 min | Old coins waking up |
/track pump 5 | Alert when BTC price rises ≥5% in 1 hour | ~1 min | Rapid price increase |
/track dump 5 2h | Alert when BTC price drops ≥5% in 2 hours | ~1 min | Flash crash detection |
Latency by tracker type
Three rule families — address_watch, whale_inflow and whale_outflow — are wired to our Mempool Radar service, which subscribes to the public Bitcoin mempool via mempool.space WebSocket and forwards an alert as soon as the transaction is broadcast (typically 1–3 seconds after relay, before block confirmation). For inflow/outflow we also subscribe to the top-N most-active labeled exchange addresses, so any transaction touching those is dispatched in real time.
Mempool transactions can be replaced (RBF) or evicted before confirmation, so the alert text always says “in mempool” vs “confirmed in block” explicitly. We never claim a tx is final until it’s in a block. The same rule won’t fire twice for the same tx (mempool detection then confirmation) — the SQL cooldown on each rule absorbs the duplicate.
Dormant-wallet checks run every 10 minutes on confirmed blocks. Price pump/dump checks run every 1 minute against the live crypto_prices feed.
Managing Trackers
/track— with no arguments, prints a friendly setup guide with copy-paste examples/mytracks— list all your active trackers with IDs and trigger counts/untrack 3— remove tracker #3/track dashboard 5 on— pin a tracker so it appears as a live ticker on your dashboard
You can have up to 10 active trackers. Each tracker has a 60-minute cooldown by default. The cooldown SQL filter ensures the same rule never fires for the same event twice across the mempool and confirmation paths.
/track inflow 1000 + /track outflow 500 + /track dump 3 + /track dormant 5 gives realtime coverage of exchange flows in both directions, plus crashes and ancient-wallet activity.
18b. Any-Address Lookup Free demo
The dashboard ships a public any-address lookup widget at the top of the page. Drop in any Bitcoin address (not just our tracked whales) and you get live balance, transaction count, mempool stats, and — depending on tier — recent transactions and unspent outputs. This is the differentiation feature versus Glassnode and CryptoQuant, neither of which exposes raw per-address lookups in their UIs.
Tier limits
| Tier | Daily limit | Payload | How to access |
|---|---|---|---|
| Anonymous | 10 / IP / day | Summary only (balance, tx count, mempool) | Just open the dashboard |
| Logged-in | 50 / day | Summary + 5 recent TXs | Telegram / Google / Email login (free 90-day trial) |
| Premium 49 CHF/mo | 100 / day | Summary + 20 UTXOs + 20 recent TXs | Active Premium subscription |
| Research API 149 CHF/mo | Unlimited | Full payload, programmatic access | Bearer token, /v1/address/{addr}/lookup |
How the data flows
- DB cache (5-minute TTL) — if the address was looked up recently, response is <5ms regardless of upstream availability.
- electrs primary — our own Electrum-protocol server reading directly from our local Bitcoin Core full node. No third-party rate-limit, byte-perfect data.
- mempool.space fallback — if electrs times out (1.5s budget) or hits its circuit-breaker, we proxy to mempool.space's public REST API. Globally rate-limited to 5 QPS shared across all our services so we don't hammer the upstream.
Each response includes a summary._source field telling you which path served the data: electrs | mempool.space | (implicit cache when not annotated). This is transparency, not a leak — consumers should know if they're reading our own infra or a fallback.
What it does not include
The lookup endpoint is a pure on-chain proxy. It does not include our entity labels, cluster membership, volume-index calibration, or whale-trade history — those are reserved for tracked-whale endpoints (/v1/address/{addr}) which only resolve addresses already in our metrics cache. If you need both raw chain data and our enrichment, query both endpoints and merge client-side.
API tier (Research, 149 CHF/mo)
For unlimited programmatic access, the Research API exposes GET /v1/address/{addr}/lookup with Bearer auth (token format swi_live_<keyid>_<secret>). Query params utxos=1, txs=1, tx_limit=N control payload depth. Full OpenAPI 3.0 spec at /v1/openapi.json. See section 19b for tier signup.
Free for academic researchers
If you have a verified academic email (.edu, .ac.uk, .uni-*, Swiss universities, etc.), apply via the Academic Tier signup on the apex landing for 12 months free Research API access followed by a permanent 50% discount (74.50 CHF/month) thereafter. Magic-link verification, no credit card, no manual approval. Aimed at academic publications, journalist forensics, and grant-funded research.
19b. Subscription Tiers — Trial, Intelligence, Research API
Swiss Whale Intelligence has three tiers. All Telegram-login users start on a 90-day trial with full Intelligence features plus limited API access.
| Feature | Trial (90d) | Intelligence | Research API |
|---|---|---|---|
| Price | Free | 49 CHF/month | 149 CHF/month |
| Dashboard real-time | ✓ | ✓ | ✓ |
| Live whale feed (all TXs) | ✓ | ✓ | ✓ |
| TX detail pages + on-chain balance | ✓ | ✓ | ✓ |
| Custom alert trackers | ✓ (10 rules) | ✓ (10 rules) | ✓ (10 rules) |
| Address profiles + heatmap | ✓ | ✓ | ✓ |
| REST API access | 10k req/month | — | 100k req/month |
| Per-minute rate limit | 30/min | — | 60/min |
| CSV export + Jupyter templates | ✓ | — | ✓ |
| HMAC signed requests | Optional | — | Optional |
| OpenAPI 3.0 spec | ✓ | — | ✓ |
| Academic / institutional discount | — | — | On request |
Why no API access on Intelligence? The 49 CHF Intelligence tier is optimized for analysts who live in the dashboard. Research API (149 CHF) adds programmatic access for engineers, academic researchers, and trading desks that need to pipe data into Jupyter, Pine Script, Quantpedia backtests or internal dashboards.
19c. Open Ledger — Archive & Verification
Every completed Kraken-bot trade is published with SHA256-verifiable CSVs. Two download variants are offered on btcwhalealerts.com/ledger/:
- Complete Lifetime Ledger (
latest_all.csv) — all 697 trades since July 2025, ~100 KB. Every row: strategy, UTC timestamps, buy/sell prices, return %, fees, hold duration, exit reason. - 90-Day Rolling Window (
latest_90d.csv) — recent ~43 trades, for quick checks. - Full Archive at
/ledger/archive/— 41 weekly PDFs + 9 monthly CSVs + 3 quarterly analytics PDFs, each with its own SHA256.
Integrity verification:
curl -O https://btcwhalealerts.com/ledger/latest_all.csv
curl -O https://btcwhalealerts.com/ledger/latest_all.csv.sha256
sha256sum -c latest_all.csv.sha256
Transparency note: Two historical strategies (whale_cluster,
intraday_drawdown) are in the ledger but were deactivated in April 2026
because their 71% win rate had 4× asymmetric loss magnitude, netting overall negative.
Published anyway — we show all trades, including the losing ones.
metadata.json index (which contains all SHA256 hashes) will be anchored in a
Bitcoin transaction, making the entire archive provably unforgeable.
19d. Privacy, Login & API Authentication
Telegram Login (Dashboard)
Login uses the official Telegram Login Widget. When you click "Log in with Telegram", Telegram sends us a signed payload (user ID, name, photo URL, auth_date, hash). We verify the signature against our bot token — if it doesn't match, login is rejected.
After verification, the server sets a single httpOnly Secure SameSite=Lax cookie (swi_session, 90-day expiry). No authentication data is stored in localStorage. XSS attacks cannot read the cookie, and the user_id never appears in URLs, referrers, or logs.
API Authentication
REST API calls require a Bearer token created on the API Access page. Format:
Authorization: Bearer swi_live_<keyid>_<secret>Keys are bound to your tier: Trial → 10k/month, Research → 100k/month. Rate limits are enforced per-key and returned as response headers:
X-RateLimit-Limit-Monthly:  100000
X-RateLimit-Remaining:      87341
X-RateLimit-Reset:           1776562800
Optional HMAC signing is available for hardened authentication workflows — sign the request body + URL with your HMAC secret and include X-SWI-Signature: sha256=....
Data we collect
- Telegram: user ID, first name, username (all optional on Telegram side)
- Stripe: name, billing country + last 4 digits of card (Stripe-hosted, never on our servers)
- Google Analytics 4 (consent-gated): aggregate page views, no personal identifiers
- Server logs: IP hashes (30-day retention), no raw IPs stored
Full data policy: btcwhalealerts.com/privacy/ (revDSG + GDPR compliant).
20. MCP Server — Connect AI Assistants to the Same Data
The same on-chain data you see on this dashboard is also available to AI assistants — Claude, Cursor, ChatGPT, Continue.dev, Zed — through the Model Context Protocol (MCP). Once connected, you can ask your assistant questions like "check whether the recent 1,200 BTC outflow from Binance came from a known cold-wallet cluster" and it will call our tools live, no copy-paste, no API key management.
What you get over MCP
- 27 specialized tools — whale lookups, exchange flow analysis, HODL waves, SOPR, MVRV per address, miner balances, frequency context, cohort breakdowns, transaction details, and entity search
- 3.85M canonical clusters from common-input-ownership analysis (Meiklejohn-style)
- 1.1M+ entity-labeled addresses — exchange hot/cold wallets, custodians, miners, OTC desks
- BTC + ETH coverage across both chains in a single MCP server
- OAuth 2.1 click-to-install — no API keys to copy-paste
Tier mapping (same as the dashboard)
| MCP Tier | Equivalent dashboard tier | Rate limit |
|---|---|---|
| Free | Free / Guest | Conservative limits, public tools only |
| Intelligence | Premium (Telegram trial) | All real-time tools, full address detail |
| Research | API customers | Higher rate limits, longer history TTLs, every tool |
Quick start
- Open btcwhalealerts.com/mcp/
- Pick your client (Claude.ai, Claude Desktop, Cursor, Continue.dev, Zed) and follow the click-to-install button
- Sign in with your existing Telegram-linked account — tier is detected automatically
- Start asking questions in your AI chat — the assistant will call
whale_lookup,whale_exchange_flows,whale_tx_detailetc. on demand
Full documentation, tool reference, install guides for all 5 clients, and a workflow cookbook: btcwhalealerts.com/mcp/
21. Frequently Asked Questions
What counts as a "whale" transaction?
Any Bitcoin transaction with a total value of ≥50 BTC (Premium) or ≥200 BTC (Free). The system monitors the Bitcoin mempool and confirmed blocks in real-time using a full Bitcoin Core node.
What is the Volume Index?
The Volume Index (0–100%) reflects an address's historical exchange-flow magnitude. Important: High Volume Index = recurring large player, NOT a profitability signal. Well-known whale addresses are often already "priced in" by the market. New addresses with low Volume Index can sometimes deliver earlier signals.
What do the flow types mean?
to_exchange: BTC sent to a known exchange. from_exchange: BTC withdrawn from an exchange. wallet_to_wallet: Transfer between non-exchange addresses (consolidation, cold storage, or OTC deals). exchange_to_exchange: Transfer between two known exchange addresses. self_send: Internal change-output sweep — the largest input and largest output go to the same address (typical Hot-Cold-Consolidation pattern). Self-sends are operational, not real cross-address flows, and are excluded from headline whale counters since 2026-04-25.
How often is the data updated?
The dashboard refreshes every 30 seconds. Premium users see transactions within 1–2 minutes of broadcast. Free users see data with a 3-hour delay.
How does the 90-day free trial work?
Log in with Telegram → Premium activates instantly for 90 days. No credit card, no payment, no strings. After 90 days, you revert to Free unless you subscribe.
What is a "Mega Whale"?
A transaction of ≥1,000 BTC. These are rare (typically a few per day) and often represent institutional or major exchange movements.
Where does the data come from?
All blockchain data comes from our own full Bitcoin Core node — no third-party APIs for transaction data. Price data comes from CoinGecko. Exchange identification uses a curated watchlist of 830,000+ addresses built from on-chain heuristics and public labels.
Can I get alerts on my phone?
Yes. We send whale alerts via Telegram, Discord, and Bluesky — all free. Premium Telegram subscribers also receive detailed alerts with signed links to full analysis pages.
What does the Exchange Flows net signal mean?
Net = Outflows minus Inflows. Positive net (more BTC leaving exchanges) is an outflow-dominant pattern (often labeled accumulation). Negative net (more BTC entering exchanges) is an inflow-dominant pattern (often labeled selling pressure). The badge shows the current direction based on the magnitude.
Is this financial advice?
No. Swiss Whale Intelligence provides on-chain data and analytics for educational and informational purposes. It does not provide financial advice, trading signals, or investment recommendations. Always do your own research.
How many addresses are monitored?
Our watchlist contains over 830,000 Bitcoin addresses, including known exchange hot/cold wallets, OTC desks, mining pools, and large holders. The system processes every transaction on the Bitcoin network and filters for those meeting the minimum size threshold.
22. Glossary — Technical Terms Explained
A reference of every technical term used across the dashboard, alert pages, and whale profiles.
Blockchain & Bitcoin
| Term | Definition |
|---|---|
| BTC | Bitcoin — the native cryptocurrency of the Bitcoin network. 1 BTC = 100,000,000 satoshis. |
| Transaction (TX) | A transfer of BTC from one or more input addresses to one or more output addresses, recorded permanently on the blockchain. |
| TXID | Transaction ID — a unique 64-character hexadecimal hash that identifies a specific Bitcoin transaction. |
| Block | A bundle of transactions confirmed together by miners. One block is created approximately every 10 minutes. |
| Block Height | The sequential number of a block in the chain. Block #945000 means it is the 945,000th block since the genesis block. |
| Mempool | The "waiting room" for unconfirmed transactions. When you send BTC, it enters the mempool before being included in a block. |
| Confirmation | Each block added after a transaction's block counts as one confirmation. More confirmations = higher finality. 6 confirmations is generally considered irreversible. |
| sat/vB | Satoshis per virtual byte — the fee rate of a transaction. Higher sat/vB = faster confirmation. Typical range: 1–100+ sat/vB. |
| UTXO | Unspent Transaction Output — the fundamental unit of Bitcoin ownership. Your "balance" is the sum of all UTXOs your address controls. |
| SegWit / bech32 | Address formats. SegWit (bc1q...) and bech32 (bc1p...) are modern, efficient formats with lower fees than legacy (1... or 3...) addresses. |
| RBF (Replace-By-Fee) | A transaction flag that allows the sender to increase the fee later to speed up confirmation. |
| Halving | A programmed event (every ~4 years) that cuts the mining reward in half. Reduces new BTC supply, historically followed by price increases. |
Whale Intelligence
| Term | Definition |
|---|---|
| Whale | An entity holding or moving a very large amount of BTC. On this platform: ≥50 BTC (Premium) or ≥200 BTC (Free). |
| Mega Whale | A transaction of ≥1,000 BTC. Typically institutional, exchange cold wallet moves, or major OTC deals. |
| OTC (Over-the-Counter) | Off-exchange trade negotiated directly between two parties, often via desks like Cumberland or Genesis. Typically settled on-chain as a single large wallet_to_wallet transfer with no exchange touch. Used by institutions to move large size without slippage or public orderbook impact. |
| Hot-Cold Consolidation | An exchange's internal sweep moving BTC from hot wallets (online, used for withdrawals) to cold storage (offline, long-term custody) — or vice versa. Looks like a large transfer but does not change the exchange's total reserves. Often misread as an inflow/outflow signal. |
| DEX (Decentralised Exchange) | A non-custodial trading venue where users trade from their own wallets via smart contracts (e.g. Uniswap, dYdX). On Bitcoin itself rare; relevant for ETH and the wider crypto context. Flows to/from DEX contracts behave differently from centralised-exchange flows. |
| Volume Index | A 0–100% score reflecting an address's historical exchange-flow magnitude. Computed from peak BTC moved to/from exchanges. High = recurring large player, NOT a profitability signal. |
| Flow Type | Classification of a transaction: to_exchange (BTC moving onto exchange), from_exchange (BTC moving off exchange), wallet_to_wallet (cross-address transfer between non-exchange wallets, e.g. OTC), exchange_to_exchange (inter-exchange transfer), self_send (internal change-output sweep, same address on both sides — not a real cross-address flow, excluded from headline counters). |
| Entity Label | A human-readable name attached to a known address (e.g. "Binance Hot Wallet", "Coinbase"). Identified through on-chain heuristics and public labels. |
| Cluster | A group of addresses believed to be controlled by the same entity. Identified through common-input-ownership heuristics and change address detection. |
| Dormant Whale | An address that has not moved BTC for an extended period (typically months/years) and then suddenly transacts. These events can signal major market moves. |
| Whale Fingerprint | A behavioral profile of a recurring whale address: typical transaction size, timing patterns, directional bias (buy/sell), and average market impact. |
| Whale Cluster | Multiple addresses (often hundreds) that common-input-ownership analysis shows are controlled by the same entity. Unlike a single "Cluster" entry, a whale cluster describes the aggregate on-chain footprint of one real-world actor. |
| Confidence | A 0–1 score attached to intent classifications, entity labels, and cluster assignments. Reflects how certain our heuristic is. High confidence (>0.8) = strong evidence (e.g. curated label); low confidence (<0.6) = pattern match only. |
| Volume-Weighted | An aggregation method where each address contributes proportionally to its Volume Index. Example: a "volume-weighted whale count" emphasises addresses with larger historical exchange-flow magnitude. |
| Signal Intelligence | Our umbrella term for combining raw on-chain data (flows, clusters, dormancy, SOPR) with contextual layers (entity labels, volume indices, time-of-day patterns) into a human-readable narrative about whale behaviour. |
| Watchlist | Our curated database of 830,000+ Bitcoin addresses with associated metadata (exchange labels, volume indices, last activity). |
| Custodian | A regulated entity that holds crypto on behalf of clients (institutional or retail) — examples: Coinbase Custody, BitGo, Anchorage, Fireblocks, Komainu. Cold-wallet movements from custodians are often misread as exchange flows; on this platform they are tagged as custodian entity-labels and excluded from exchange inflow/outflow counters. |
| Intent Classification | An automatic label attached to each whale transaction describing its likely purpose: distribution (sending to an exchange = potential sell), accumulation (withdrawing from exchange to private wallet), internal rebalancing (hot↔cold, exchange↔exchange), or OTC (large wallet-to-wallet, off-exchange). Confidence scores (0–1) accompany each classification. |
Market & Trading Indicators
| Term | Definition |
|---|---|
| Exchange Inflow | BTC being sent to exchange deposit addresses. Often interpreted as intent to sell, since exchanges are where selling happens. |
| Exchange Outflow | BTC being withdrawn from exchanges to private wallets. Interpreted as accumulation — taking coins off exchanges reduces available supply. |
| Exchange Reserves | Estimated total BTC held on exchanges, approximated by cumulating net flows over time. Declining reserves = outflow-dominant trend (less BTC custodied on exchanges). |
| Net Flow | Outflows minus Inflows for a given window. Positive = more leaving exchanges (outflow-dominant). Negative = more entering exchanges (inflow-dominant). |
| Cumulative Net Flow | The running sum of daily Net Flow. Removes noise and shows the macro trend. A steadily declining cumulative = exchanges are bleeding supply over weeks/months. |
| Multi-Strategy Signal | A composite alert that triggers only when several independent indicators agree (e.g. exchange inflow spike and SOPR <1 and dormant wallet awakening). Reduces false positives compared to any single signal. |
| Fear & Greed Index | A 0–100 score from alternative.me measuring market sentiment. 0–24 = Extreme Fear, 25–49 = Fear, 50–74 = Greed, 75–100 = Extreme Greed. Contrarian indicator — extreme fear has historically preceded local lows. |
| BTC Dominance | Bitcoin's share of the total cryptocurrency market cap (typically 40–60%). Rising dominance = money flowing into BTC over altcoins. |
| ETH Dominance | Ethereum's share of the total cryptocurrency market cap (typically 15–25%). Rising ETH dominance alongside falling BTC dominance often signals "altcoin season" — capital rotating from Bitcoin into Ethereum and the broader smart-contract ecosystem. |
| Perpetual Futures (Perps) | Futures contracts with no expiry date, the dominant derivatives instrument in crypto. Price tracks spot via the Funding Rate. The bulk of leveraged BTC trading volume happens on perps (Binance, Bybit, OKX), making Funding Rate and Open Interest critical context for whale moves. |
| Accumulation / Distribution | Two macro phases of whale behaviour. Accumulation: whales withdraw BTC from exchanges into private wallets (outflow-dominant) — quietly building positions, often during fear/lows. Distribution: whales send BTC back to exchanges (inflow-dominant) — selling into strength, often during greed/highs. The Exchange Reserves chart visualises the net of both. |
| Cost Basis | The original price at which a UTXO (or cohort of UTXOs) was acquired. On-chain proxies use the BTC price at the block height when the coin last moved. Cost basis is the foundation for SOPR, MVRV, and realised-profit calculations — it tells you whether holders are selling at a profit or a loss. |
| OHLC | Open, High, Low, Close — the four price points that define a candlestick for a given timeframe (1m, 5m, 1h, 1d, etc.). The Kraken trading bot uses 60-minute OHLC for the volatility/mean-reversion strategy; price charts on the platform are aggregated from OHLC data in crypto_prices. |
| Funding Rate | A periodic payment between long and short traders on perpetual futures. Positive = longs pay shorts (long-dominant). Negative = shorts pay longs (short-dominant). Extreme values often precede reversals. |
| Open Interest (OI) | Total value of outstanding futures contracts. Rising OI + rising price = strong trend. Rising OI + falling price = building short pressure. |
| Orderbook Depth | The volume of buy (bid) and sell (ask) orders at different price levels. Deep books = more liquidity, harder to move the price. Thin books = higher volatility risk. |
| Bid/Ask Ratio | Total bid volume divided by ask volume near the current price. Ratio >1 = more buying support. Ratio <1 = more selling pressure. |
| Spread | The gap between the best bid (highest buy order) and best ask (lowest sell order). Tighter spread = more liquid market. |
| Pi Cycle Top | A long-term indicator comparing the 111-day moving average with 2× the 350-day moving average. When they cross, it has historically signaled major cycle tops. |
| Stock-to-Flow (S2F) | A scarcity model: existing supply (stock) divided by annual production (flow). Higher S2F = more scarce. Bitcoin's S2F doubles at each halving. |
| SOPR | Spent Output Profit Ratio — the ratio of the price when a UTXO was spent vs. when it was created. SOPR >1 = coins moved at profit. SOPR <1 = coins moved at loss. |
| HODL Waves | Distribution of UTXOs by age. Shows what percentage of BTC supply hasn't moved in various time periods (1d, 1w, 1m, 3m, 6m, 1y, 2y, 5y+). |
| MVRV | Market Value to Realized Value — compares the current market cap to the "realized cap" (sum of all UTXOs valued at their last-moved price). MVRV >3 = overheated, MVRV <1 = undervalued. |
Benchmark Comparison — Traditional Assets
| Term | Definition |
|---|---|
| SPY | SPDR S&P 500 ETF Trust — the most-traded ETF tracking the S&P 500 index. We display the total-return series (adj-close, includes reinvested dividends), which is the honest baseline for "what would a buy-and-hold investor have earned including cash distributions". |
| GLD | SPDR Gold Shares ETF — gold-price proxy used by retail and institutional investors. Backed by physical gold held in vaults. No dividends; adj-close ≈ close. |
| AGG | iShares Core US Aggregate Bond ETF — broad investment-grade US bond market. Used as the bond leg in our 70/30 portfolio. |
| S&P 500 (price-only) | The raw ^GSPC index without dividend adjustment. Distinct from SPY total-return — useful when comparing against assets that don't pay dividends (BTC, gold). The dividend-adjustment delta over a year is roughly the dividend yield (currently ≈ 1.3 %). |
| 70/30 Portfolio | A synthetic baseline: 70 % SPY (stocks total-return) + 30 % AGG (US Total Bonds), monthly rebalanced on the first trading day of each month. The "what my private banker actually recommends" benchmark for conservative investors. Computed on-the-fly — no separate ticker exists. |
| Cumulative Return | (end_price ÷ start_price) - 1, expressed as percentage. A descriptive observation of past prices — never a forecast. The Benchmark Chart normalises every series to 100 at window start so cumulative return is just (current_value - 100) %. |
| Outperformance vs Baseline | Percentage-point delta of one series' cumulative return minus the baseline's. Additive (not annualised). Example: BTC = -18 %, SPY = +30 %, outperformance of SPY vs BTC = +48 percentage points over the window. |
| yfinance | Open-source Python wrapper for Yahoo Finance public chart API. Source for our SPY / GLD / AGG / S&P 500 daily-close data. Auto-includes dividend reinvestment via Adj Close for ETFs. |
Platform Terms
| Term | Definition |
|---|---|
| Premium | Full-access tier: real-time data, ≥50 BTC threshold, full addresses, signed analysis links. Free 90-day trial via Telegram login. |
| Freemium / Free | Guest access: 3-hour data delay, ≥200 BTC threshold, rounded amounts, masked addresses. All charts and statistics are available. |
| Signed Link | An HMAC-authenticated URL with a timestamp and cryptographic signature. Prevents unauthorized access to Premium detail pages. Links expire after 1 year. |
| Alert Tracker | A Premium feature that sends personalized Telegram notifications when your custom rules are triggered (e.g. "notify me when >500 BTC flows to an exchange"). |
| Score (Alert Score) | A 0–10 quality rating for each transaction based on size, address reputation, flow significance, and contextual factors. Higher score = more noteworthy. |
| SHA256 | The cryptographic hash function (256-bit output) used by Bitcoin for proof-of-work and address checksums. On this platform, every published CSV snapshot ships with a .sha256 file containing the hash of the data file. Anyone can re-compute the hash locally with sha256sum to verify the file has not been tampered with since publication. |
| Community Sentiment | An aggregated mood score (0–100) derived from public crypto-conversation across Reddit (r/Bitcoin, r/CryptoCurrency), Telegram public channels, and Bluesky. Updates every 30 minutes. Independent of Fear & Greed Index, which is market-derived (volatility, volume, dominance) rather than text-derived. |
| Miner Balances | The aggregate BTC held in wallets attributed to known mining pools (Foundry, AntPool, ViaBTC, F2Pool, Binance Pool, etc.). Falling miner balances often indicate distribution events (miners selling new supply onto the market). 15 mining-pool identities are tracked. |
| Exchange Flows | The net of inflows and outflows for major exchanges. The dashboard widget tracks Binance, Coinbase, Kraken, OKX, Bitfinex, Bybit, and 12 more — both as individual exchanges and aggregated. Net Inflow = Inflows − Outflows (CryptoQuant convention). |
23. Analysis Guide — How to Read the Data
Each tool on the dashboard reveals a different dimension of the Bitcoin market. Here's what each one tells you, and how to combine them for deeper insights.
What Each Tool Shows
| Tool | What It Reveals | Timeframe |
|---|---|---|
| Stats Cards | Daily activity snapshot: how many whales are moving, total volume, and the current BTC price. Start here to gauge today's activity level. | Today |
| BTC Price Chart | 24-hour price line with whale event overlay. Shows whether large moves happen before, during, or after price swings. | 24 hours |
| Exchange Flows | Who is sending BTC to exchanges (sellers) vs. withdrawing (accumulators). The most direct on-chain supply/demand signal. | 7d / 30d / 90d |
| Exchange Reserves | Cumulative net flow over time. Shows the macro trend: are exchanges gaining or losing BTC overall? | 30d / 90d / 1y |
| Fear & Greed | Market sentiment gauge. Best used as a contrarian indicator — extreme fear often presents buying opportunities, extreme greed signals caution. | 7d / 30d / 90d |
| BTC Dominance | Whether money is flowing into BTC or altcoins. Rising dominance in a downturn = flight to safety. Falling dominance in an upturn = altcoin season. | 7d / 30d / 90d |
| Orderbook Depth | Current liquidity and the balance of buying vs. selling pressure. Thin orderbooks amplify whale impact; thick books absorb it. | 6h / 12h / 24h |
| Funding Rate & OI | Derivatives market positioning. Extreme funding rates signal crowded trades that tend to unwind. Rising OI with price = strong conviction. | 72 hours |
| Whale Activity | Daily whale count and volume trend. Spikes in activity often precede volatility. Quiet periods may signal ranging markets. | 7d / 30d / 90d |
| ETH Whale Activity | Same analysis for Ethereum. Useful for gauging broader crypto market health beyond just Bitcoin. | 7d / 30d / 90d |
| Multi-Coin Cards | Quick health check of 16 major cryptocurrencies. Sparklines show 7-day trend at a glance. | 7 days |
| Live Whale Feed | Individual transaction details with entity labels, volume indices, and flow types. The raw data for your own pattern recognition. | Real-time |
| Alert Detail Pages | Deep dive into a single transaction: price impact window (±4h), 24h post-impact, on-chain balance, related transactions, cluster context. | Per TX |
| Whale Address Profiles | Long-term behavioral analysis of individual whale addresses: when they're active, how large their typical moves are, and what impact they have. | Historical |
| Pi Cycle / S2F Charts | Long-term cycle indicators. Pi Cycle signals major tops; S2F models fair value based on scarcity. Useful for macro positioning. | Multi-year |
| Alert Tracker | Custom notifications: set your own rules (size, flow direction, address) and get Telegram alerts when conditions are met. | Real-time |
Combining Tools for Analysis
The real power comes from reading multiple signals together. Here are practical analysis workflows:
Is This a Good Time to Buy?
Check: Fear & Greed (<25?), Exchange Reserves (declining?), Net Flows (outflows dominating?), Funding Rate (negative/neutral?).
Confluence pattern: Extreme fear + rising outflows + negative funding = contrarian setup pattern. Historically observed at local lows.
Should I Be Cautious?
Check: Fear & Greed (>75?), Exchange Flows (inflows spiking?), Funding Rate (extremely positive?), Pi Cycle (near crossover?).
Bearish when: Extreme greed + rising exchange inflows + high positive funding = overheated. Smart money distributing to retail.
Following Whale Activity
Check: Live Feed (large from_exchange moves?), Whale Activity chart (volume spike?), Orderbook (thin liquidity?).
Key pattern: Multiple large exchange withdrawals in a short window + thin orderbook = potential supply squeeze incoming.
Macro Cycle Positioning
Check: Pi Cycle Top (how far from crossover?), Stock-to-Flow (above or below model?), BTC Dominance (rising?).
Late cycle: Pi Cycle approaching crossover + S2F price well above model + extreme greed. Early cycle: S2F price well below model + extreme fear + rising dominance.
Evaluating a Specific Transaction
Open: Alert Detail Page → check Price Window (did price react?), On-Chain Balance (whale's total holdings?), Similar Alerts (recurring pattern?), Cluster (connected addresses?).
Key insight: A whale with 10,000+ BTC balance making their first exchange deposit in months is more significant than a routine daily transfer.
Setting Up Smart Alerts
Use: Alert Tracker with custom rules: whale_inflow >500 BTC for major inflow events, dormant for dormant address re-activations, price_dump >3% for rapid drops.
Combine with: Check the dashboard context when an alert fires — a 500 BTC inflow during extreme greed means something different than during extreme fear.